
The economic outlook in a changing world
The global economy is holding up, with growth of 3.1% in 2026, according to the IMF. More important than this reasonably reassuring headline figure, however, is the interplay of light and shade beneath it. Can the balance between a more persistent energy shock than expected and the rapid expansion of artificial intelligence endure? In AI, the demand shock is already here, but the supply shock has yet to materialise: an uncomfortable transition financed largely by borrowing. Long-term interest rates are rising, leaving a sword of Damocles hanging over the most heavily indebted borrowers. France, on the front line, is experiencing this first-hand.
World economic outlook: resilience being tested
1. Risks and uncertainty
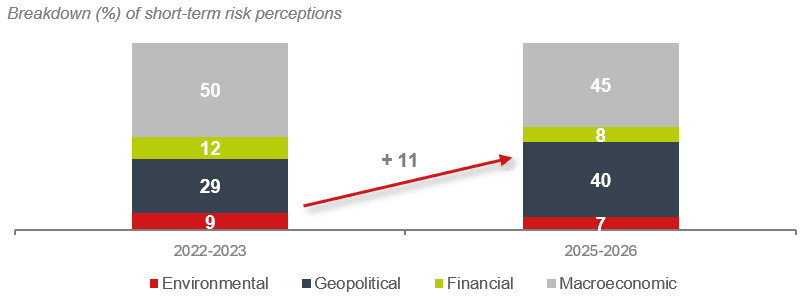
In advanced economies, geopolitical risk is increasingly seen as
a near-term concern
Sources: Accuracy, UNCTAD
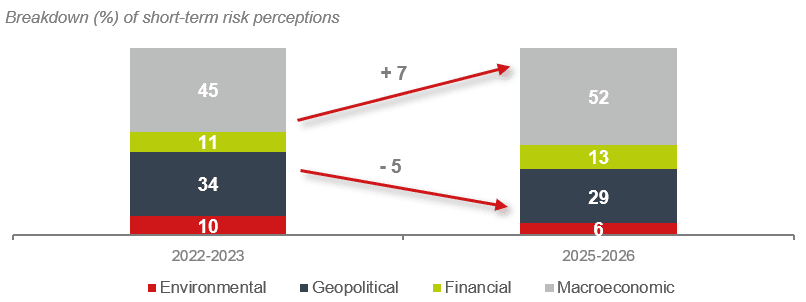
In Asia excluding China, geopolitical tensions feed through into
tighter economic and financial conditions
Sources: Accuracy, UNCTAD
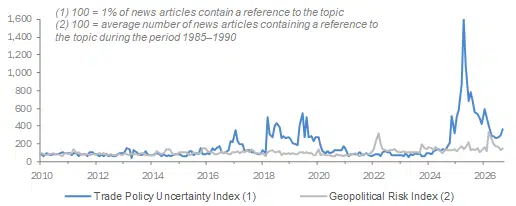
Trade policy and geopolitical uncertainty indices remain elevated
Sources: Accuracy, Caldara & Iacoviello (2022), UNCTAD
2. The IMF’s October 2026 forecasts
The IMF forecasts global growth of 3.1% in 2026, followed by 3.3% in 2027. The world economy would thus avoid recession despite an energy shock proving more persistent than expected. Yet this steady growth masks a deterioration in its composition. Higher commodity prices would push global year-on-year inflation to 4.4% in 2026, before it eases to 3.1% in 2027.
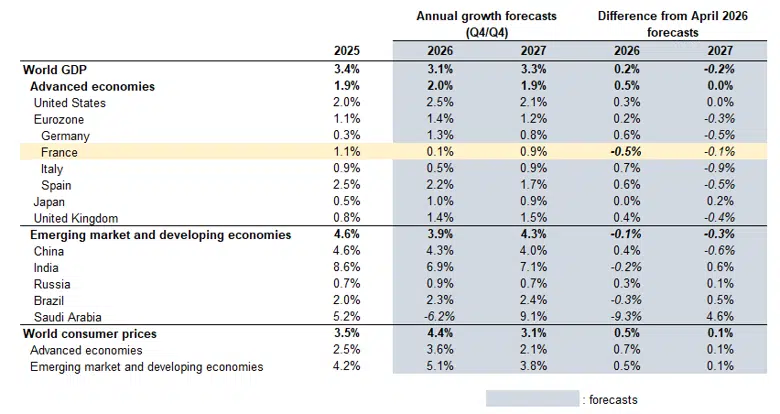
Source: IMF, World Economic Outlook, October 2026
3. The global economy faces conflicting forces
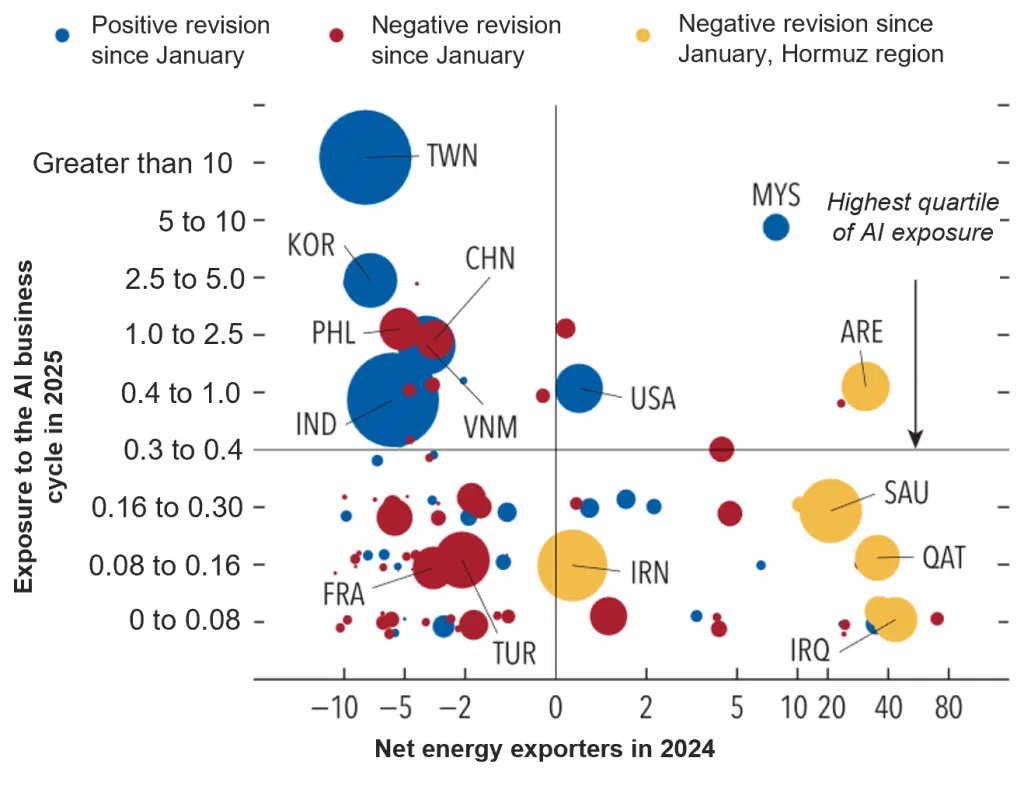
Three opposing forces cancel each other out in aggregate, but they redistribute growth towards a handful of economies. First, a negative supply shock: the closure of the Strait of Hormuz has blocked around 20 million barrels of oil a day since the start of the war launched by the United States and Israel against Iran. That is a quarter of seaborne oil trade. Oil reached $126 a barrel in late March and $110 in September.
Second, a positive demand shock: the race for AI is boosting investment in semiconductors, data centres and electricity grids, without yet delivering the positive supply shock promised by productivity gains.
Finally, fiscal and financial strains in response to the first two forces: governments are shielding households and businesses from higher energy prices and funding increased defence spending, while central banks are taking a tougher line on inflation.
Divergent forces shaping the global economy (as a percentage of
GDP): importance of GDP growth revisions
Sources: CEPII BACI, Trade Data Monitor, IMF
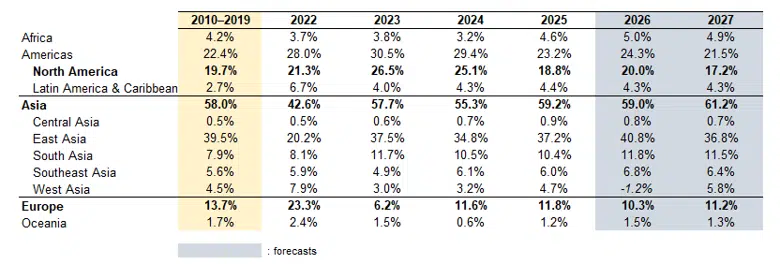
Relative contributions to global growth
Source: UNCTAD, 2026
How, then, can this apparent resilience be explained? The global economy is neither slowing nor accelerating. Growth is being redistributed according to each country’s exposure to the energy shock and AI-related demand.
Just 32 economies now account for 95% of global growth, down from 54 in April, while 47% of economies have seen their growth forecasts cut. Asia would generate 59% of global growth in 2026, including nearly 41% from East Asia alone. Western Asia, the epicentre of the conflict, would make a negative contribution of −1.2%.
The winners share a common profile: net energy exporters or links in the AI value chain. So do the losers: energy importers with little fiscal room for manoeuvre and no place in the technology supply chain.
4. Energy buffers are holding, but for how much longer?
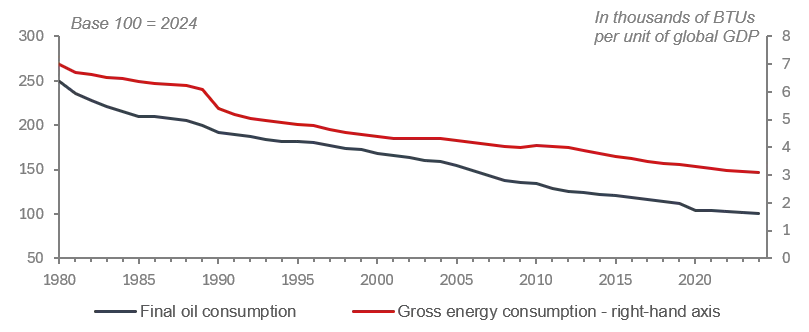
Lower energy intensity and an energy mix less reliant on oil…
Sources: Accuracy, IMF, EIA
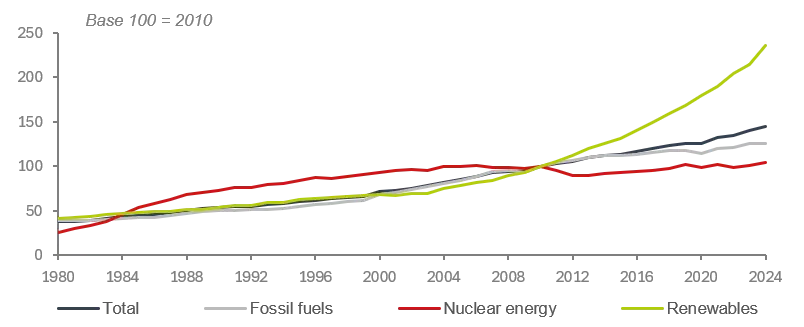
…and global production increasingly geared towards renewables
Sources : Accuracy, FMI, EIA
Flexible supply and lower oil intensity have cut the cost of the shock to a third of what it would otherwise have been. But these cushions are wearing thin.
In the second quarter of 2026, higher production outside the Gulf (+2 million barrels a day), stock drawdowns (+4 million) and demand compression (−5 million) offset more than half the loss of the over 20 million barrels a day that passed through the Strait of Hormuz before the war. Rerouting flows has also helped maintain a degree of continuity. China, the world’s largest importer, cut its crude imports by 23% year on year between March and June.
Meanwhile, energy consumption per dollar of global GDP has fallen by 32% in twenty years, and renewables have accounted for 60% of the increase in electricity generation since 2010. Since 2024, renewables have been cheaper than the least expensive new fossil-fuel option in more than 90% of cases. The transition is becoming as much a matter of energy security as of climate policy.
The IMF’s central assumption, however, is for oil to average $96 a barrel in 2026. Although Gulf crude exports recovered to an average of 88% of their pre-war level in September, escalation in the Red Sea and the Black Sea threatens alternative routes. European gas stocks are also low as winter approaches. The fundamental question remains: with AI hungry for electricity, how long can this balance last?
The shock is also asymmetric. The steepest price rises affect developing countries in Africa and Asia, while poorer households spend two to three times as much of their income on fuel as wealthier ones. Since the conflict began, the currencies of oil importers other than China have fallen by 3.9% against the dollar, while those of exporters have gained 0.4%.
5. The reshaping of global trade
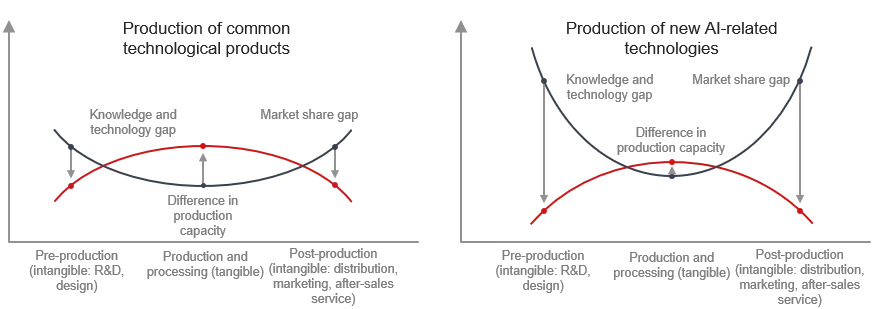
Global value chains are shifting from traditional technology sectors to new technologies
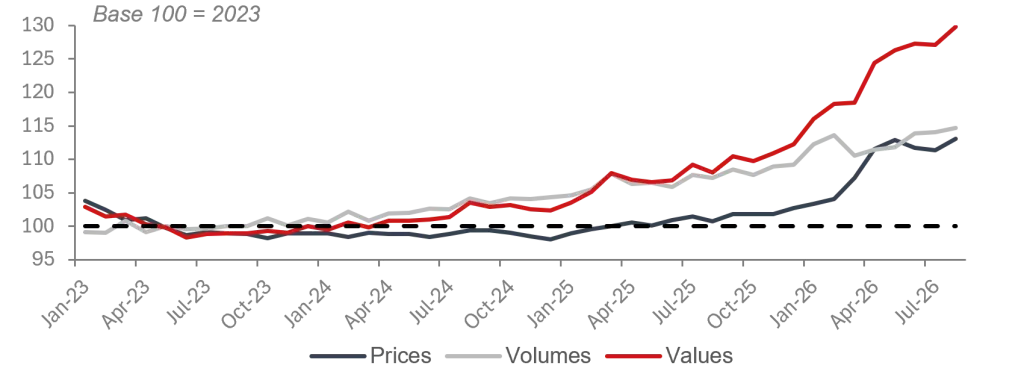
World trade reached a record $35 trillion in 2025 and is expected to grow by around 4% in real terms in 2026. Price effects, concentrated in AI-related goods, account for most of the increase in value.
The Trump administration’s various tariff policies have visibly reduced trade flows between China and the United States. Yet both countries’ total exports have remained within one percentage point of their previous trend. China has redirected 52% of its trade at risk towards third markets, with 39% directly attributable to the tariff shock. Fragmenting trade partnerships are thus reshaping trade flows.
Two indicators capture the new pattern. The average distance travelled by traded goods is increasing, but so is trading partners’ “geoeconomic compatibility”, measured by the alignment of their votes at the UN: countries are trading over greater distances, but with allies. And although trade is becoming less concentrated, it is also becoming more unequal. Major corridors are losing ground, a few are expanding, but smaller links are withering. Duplicating supply chains in this way will probably carry a long-term efficiency cost.
Price effects appear to account for a significant share of the
growth trend in global trade
Sources: Accuracy, CPB World Trade Monitor, Macrobond
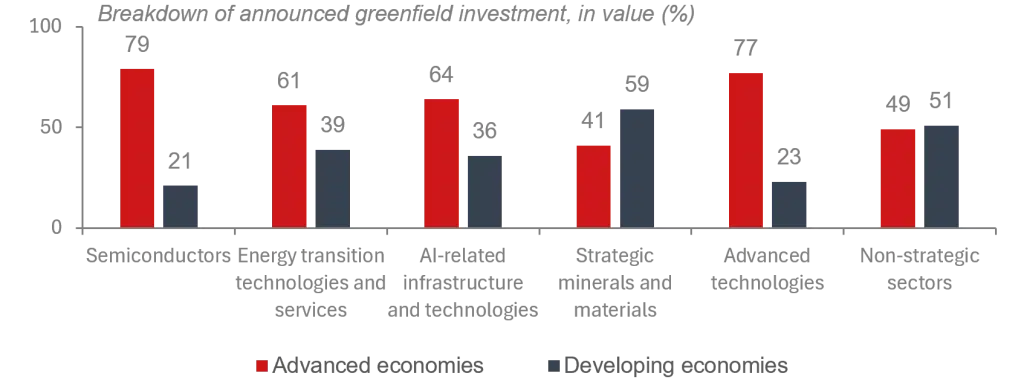
International investment in strategic sectors remains concentrated in
advanced economies
Sources: Accuracy, UNCTAD (2026)
Value no longer follows production: manufacturing alone is no longer enough to move up the value chain. Value is migrating towards intangible assets and strategic sectors. The traditional ladder of development – industrialisation, merchandise trade and integration into value chains – is losing its rungs.
Manufacturing’s share of global value added fell from around 17% in 2005 to 15.6% in 2024. Merchandise trade has plateaued as a share of world GDP since the 2008 crisis. Investment in intangible assets, meanwhile, has reached around 14% of GDP, compared with roughly 11% for tangible investment. Value appears to be created before and after the factory (in R&D, design, brands and services) where developed countries dominate.
6. Geoeconomics: explaining the reshuffle
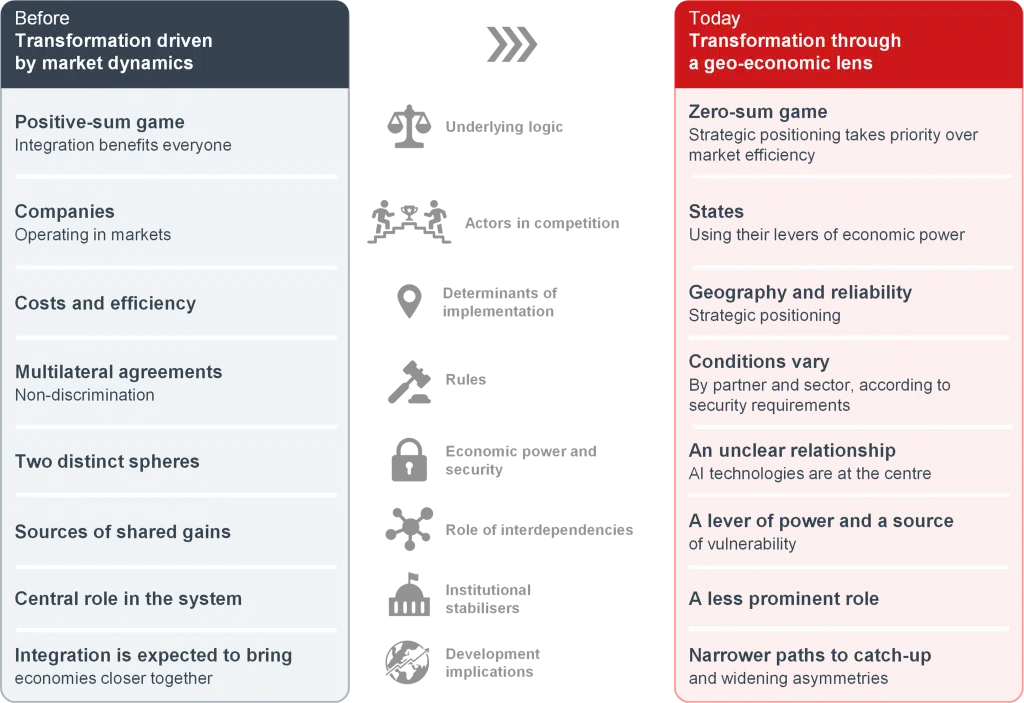
Catch-up among developing economies is fragmenting in favour
of Asia’s leading economies
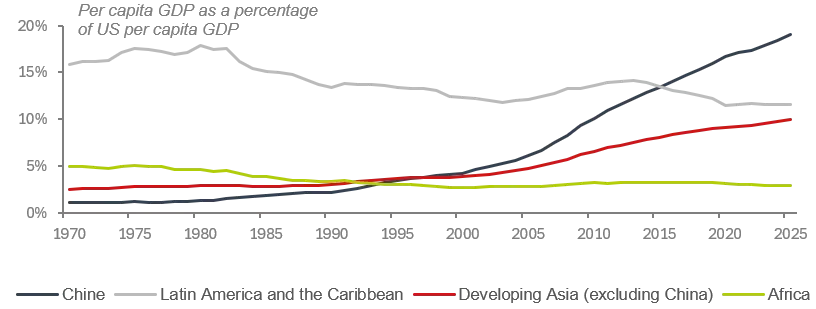
Sources: Accuracy, UNCTAD, Macrobond
The cost of this shift is visible in economic convergence. According to the IMF, emerging economies’ lead over advanced economies in GDP-per-head growth falls from 1.8 percentage points in 2025 to 0.7 in 2026. Outside a handful of Asian economies, the developing world has stopped catching up with developed countries since the mid-2010s.
7. Finance and fiscal policy: the last buffer is wearing thin
Global general government debt
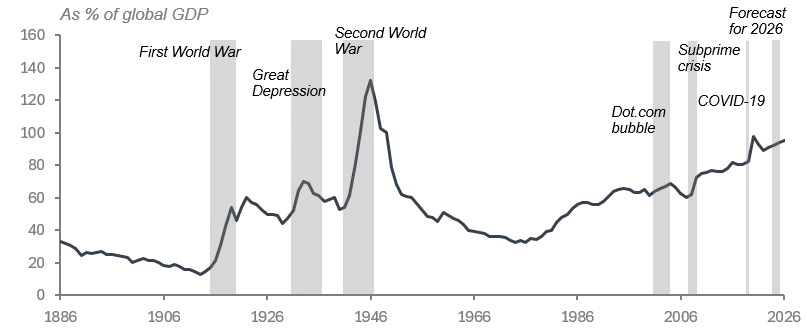
Sources: Accuracy, IMF
Three factors may explain the surprising calm in financial markets: AI exuberance, a limited ability to price extreme geopolitical risks, and the conviction that governments will step in during a crisis. On exuberance, all the indicators are flashing red. The Buffett indicator (stockmarket capitalisation relative to GDP) stands at 215%, compared with 148% in 2000. Shiller’s CAPE (cyclically adjusted price/earnings ratio) is at 42, close to its 2000 record of 44.2 and far above a historical average of around 17.
The ten largest companies account for 37% of the market, and NVIDIA trades at 365 times earnings at its peak, compared with 120 times for Cisco in 2000.
More importantly, $4.1 trillion of the $5.5 trillion in AI investment planned by 2030 would be debt-financed (i.e. around 75%).
Meanwhile, long-term sovereign bond yields in the United Kingdom, the United States and France have reached two-decade highs. The Fed raised interest rates in September, and most observers agree that further increases will follow. Core inflation is not expected to return to 2% until mid-2028 in the United States and the Eurozone.
Fiscal adjustment needed in 2027 to stabilise debt-to-GDP
by 2060 (% of potential GDP)
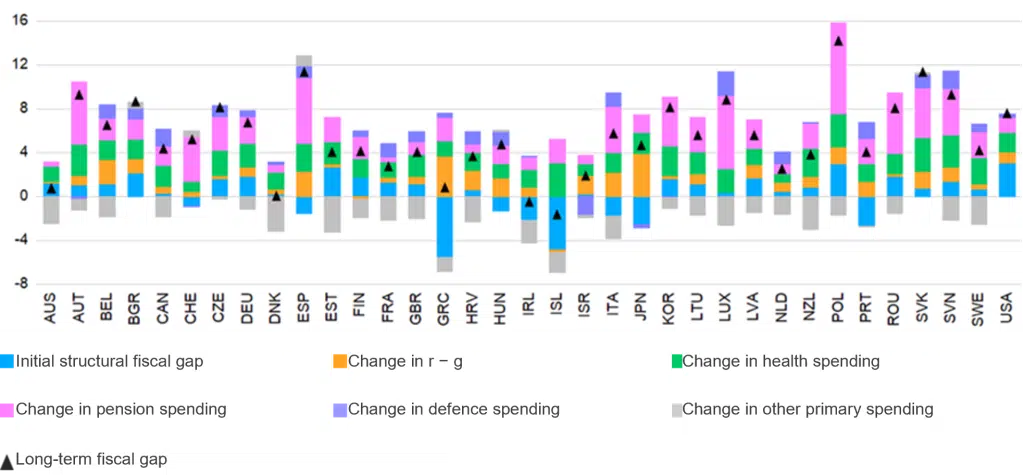
Source: OECD, 2026
Finally, global debt rises after every major shock. Primary deficits in 2020–2025 remained well above their pre-pandemic levels, and stabilising debt at its 2025 level would require a larger adjustment than currently planned.
The OECD puts the scale of the challenge into perspective. To stabilise gross debt close to its current level by 2060, the median country would need to improve its primary balance by 4.7 percentage points of potential GDP from 2027, and by more than eight points in ten countries. Ageing is the main driver: 2.2 percentage points for pensions and 1.8 for healthcare and long-term care, on top of an initial imbalance of 0.9 points and defence spending. Without adjustment, the median country’s net debt would rise by 43 percentage points of GDP by 2045.
8. Rethinking industrial policy
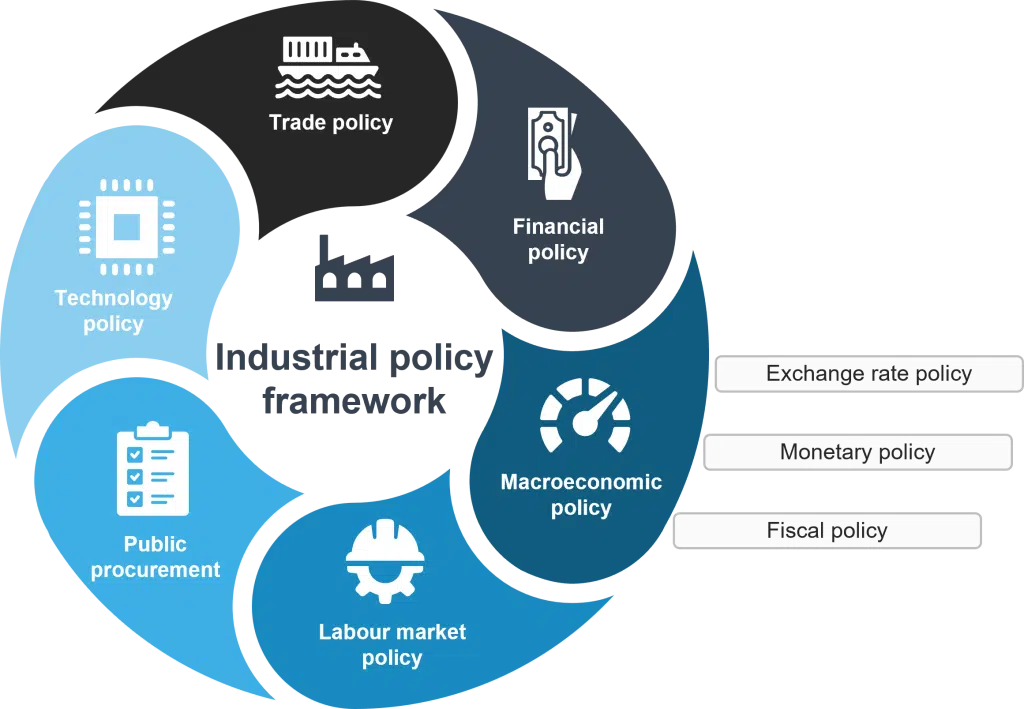
A central instrument of geoeconomics, industrial policy is no longer confined to a few sectoral subsidies. It now draws on a co-ordinated set of levers. Between 2022 and 2025, trade and financial policies were at its core (domestic financial measures, regulation of foreign direct investment and capital controls) ahead of public procurement, local-content requirements and fiscal policy.
Financial policy therefore plays a strategic role. Capital controls, long seen as a brake on development, are becoming a way to contain macrofinancial volatility and channel domestic savings towards industrial objectives. Similarly, where advanced economies screen foreign investment on security grounds, developing countries can make it conditional on links with local businesses, skills transfers and the creation of value added at home.
Each country nevertheless faces its own “development frontier”, which shifts as value reorganises around new sectors. A country’s ability to position itself depends less on its endowments than on its capacity to integrate into these activities and retain the value they generate over time.
Focus on AI
1. AI: the range of scenarios
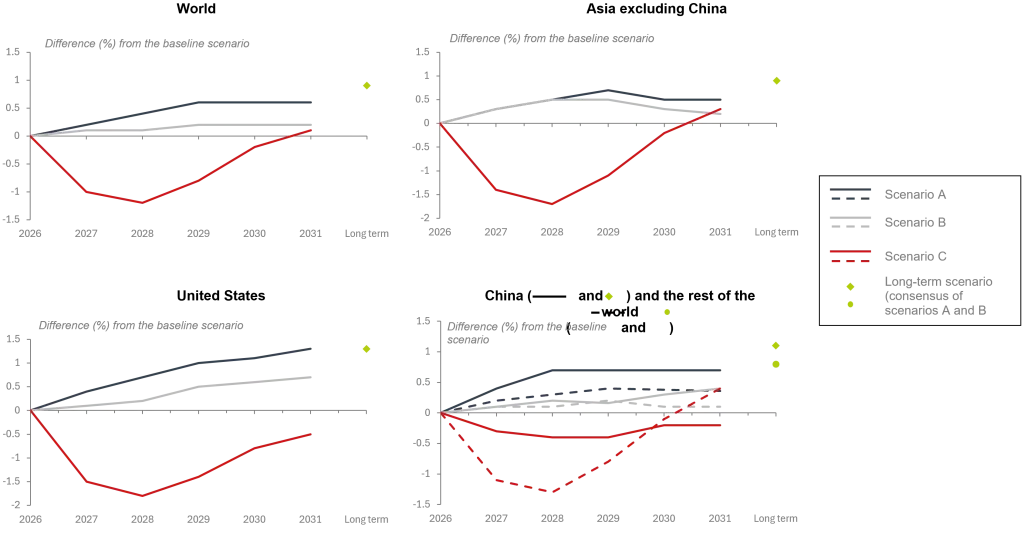
Scenario A: AI delivers on its promises. US investment rises by 4% by 2029 and Chinese investment by 1%. With capital goods manufactured in Asia, US imports surge, benefitting Asian exporters, provided their production capacity can keep pace. Total factor productivity rises by 0.8% over ten years. Global GDP is 0.6% higher in 2029 and nearly 1% higher in the long run.
Scenario B: Supply fails to keep pace. Spending is unchanged, but Asia struggles to expand capacity. Export prices in Asia excluding China jump by 10%, and by 40% for high-end technology, worsening the terms of trade for importers such as the United States and other advanced economies. The gain in global GDP in 2029 is just 0.2%.
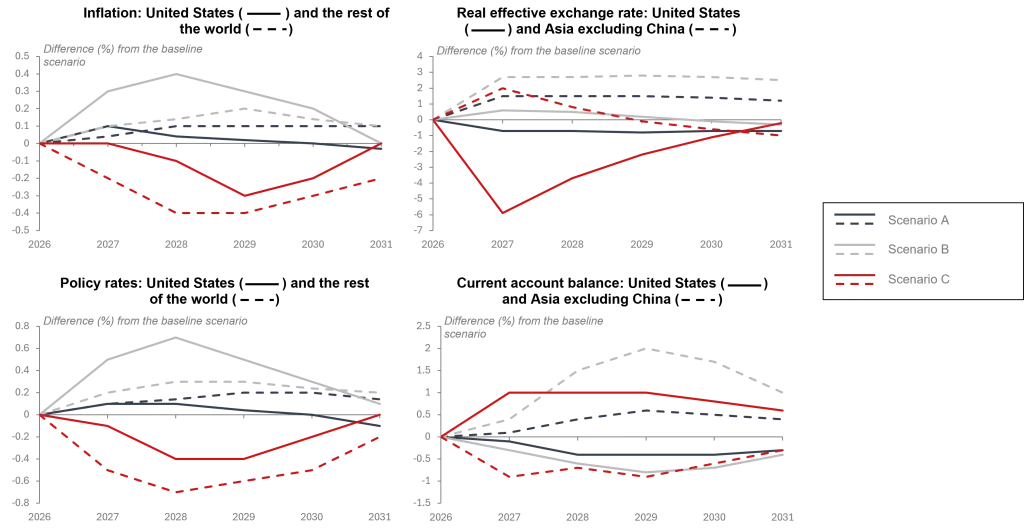
Scenario C: Markets correct. Productivity gains fail to materialise and US technology investment goes into reverse. Equities fall by 20% in the United States and 15% elsewhere. Corporate risk premiums surge by 75 basis points in the United States and up to 100 basis points in emerging economies. Term premiums rise by 30–50 basis points in advanced economies. Asian technology export prices fall by 20%. In 2028, global GDP is 1.1% below the baseline, with US GDP 1.8% lower and Asian GDP 1.7% lower. Lower inflation and interest rates offer some consolation.
Impact of the three scenarios on GDP levels
Sources : Accuracy, IMF
Impact of the three scenarios on major macroeconomic indicators
Sources : Accuracy, IMF
2. Value creation: where, and for whom? The example of computing power
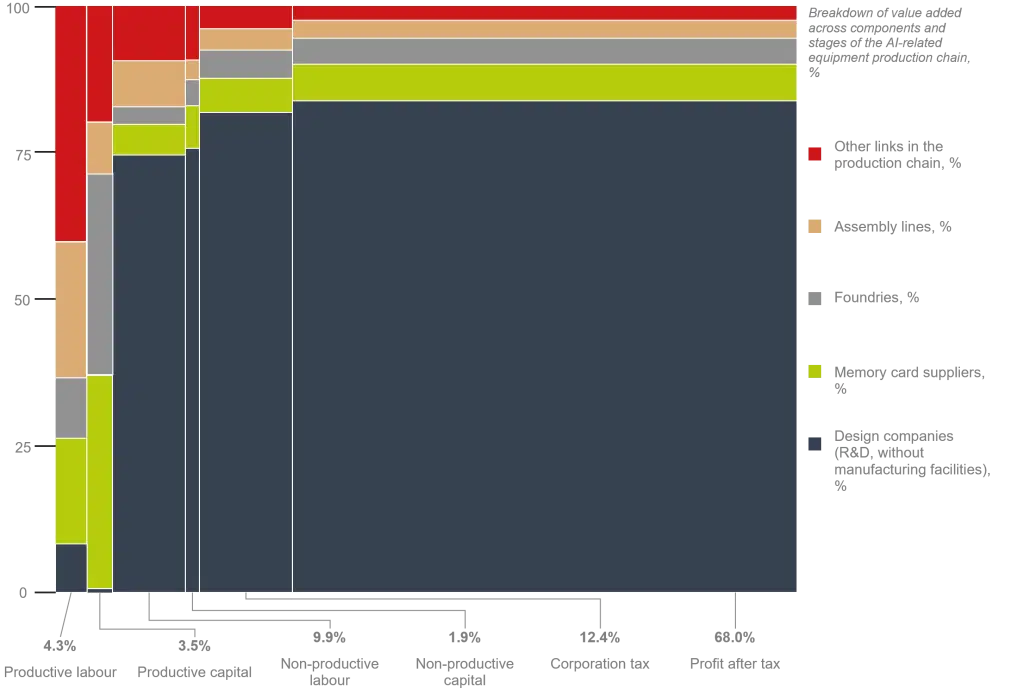
Workers receive less than 15% of the value added from the production of
equipment used to develop artificial intelligence
Sources: Accuracy, UNCTAD (2026)
In the short term, AI boosts exports, investment and capital intensity. AI-related products are now the main driver of merchandise trade, although this spectacular rise as a share of world GDP is largely a price effect.
Concentration at three levels:
- Production: Taiwan and South Korea account for 62% of net trade in AI-related computing hardware (IMF).
- Absorption: China and the United States account for more than 75% of net imports in 2025 and 57% of data centres built since 2024 (IMF).
- Value capture: 82% of value added accrues to four segments: chip design, foundry manufacturing, memory, and assembly and testing. After-tax profit captures 68% of the value added traced through the chain; labour receives less than 15%.
Developing countries participate through assembly, as in Mexico and Malaysia, or raw materials, accounting for less than 1% of value (UNCTAD).
3. The demand shock is here, but the supply shock is still to come: who finances the gap?
AI is everywhere: in Asian chipmakers’ order books, US growth, stockmarket valuations and the daily lives of seven adults in ten. Yet it remains largely absent from total factor productivity (TFP). A gap has opened between the investment made and the benefits demonstrated.
A. A growth engine… still running on capital
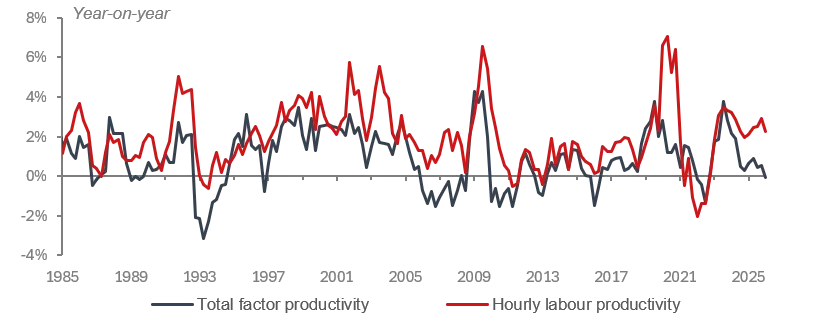
United States: AI’s promised productivity gains are not yet
evident in the data
Sources: Accuracy, BLS, FRB of San Francisco, Macrobond
In the short term, AI is a historic demand shock, set to surpass the railway, electricity and internet investment cycles. The six major hyperscalers are expected to invest nearly $1.3 trillion in 2027, equivalent to the GDP of the Netherlands.
On the supply side, the picture is more nuanced. US hourly labour productivity is growing by more than 2%, well above its post-2005 average. Yet total factor productivity, adjusted for capacity utilisation, remains slightly negative. Workers are producing more because they have better equipment, not because the economy combines its inputs more intelligently. For now, this is capital deepening, not a technology-driven supply shock.
In 1987, Robert Solow, that year’s Nobel laureate in economics, wrote: “You can see the computer age everywhere but in the productivity statistics.” Electricity and computers both took more than ten years to show up in aggregate data, the phenomenon known as the “Solow paradox”. AI’s potential contribution of around half a percentage point to annual global growth over ten years remains a forecast, not an observation.
B. For businesses, the bill arrives before the payoff
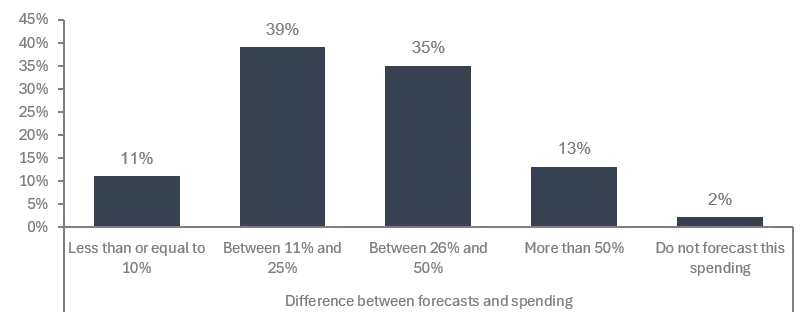
A large majority of firms cannot accurately forecast their AI spending
Sources: Accuracy, Mavvrik and Benchmarkit – 2026 State of AI Cost Governance Report
A survey of 400 companies delivers a stark verdict: almost all track their AI costs, but only 11% forecast them to within 10%, down from 15% a year earlier. Six in ten confirm that unexpected AI costs have forced them to reconsider decisions; one in four has suspended or abandoned a project. And 63% report a hit to gross margins of 6–15 percentage points. Although autonomous agents are deployed almost everywhere (by 98% of respondents) they and their costs feature in only 36% of financial reports.
Sector-level figures are equally revealing. AI spending has forced 60% of manufacturing companies to revise their prices, while more than a third of AI infrastructure providers have had to abandon projects because of unexpected costs – twice the proportion in any other segment. Retailers, by contrast, focus AI on repetitive, measurable tasks and forecast their costs twice as accurately as the average. More than the technology itself, cost visibility separates winners from losers. Setting clear limits on use cases and properly accounting for them is becoming the first condition for profitability.
C. Credit markets do the sums
Leverage is expected to peak in 2028
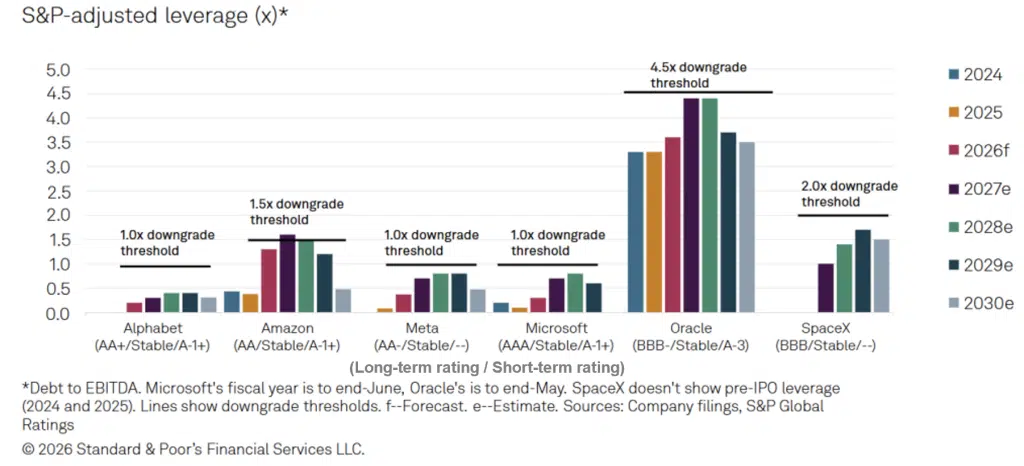
More than $450 billion of AI-related debt has been issued this year, while hyperscalers’ share of investment-grade issuance (IG, a rating above BBB−) has risen from less than 1% to 10% in two years.
On top of this come circular arrangements, with the giants funding laboratories that then buy computing capacity from them, off-balance-sheet commitments and guarantees for more fragile “neocloud” providers.
Meta’s free cash flow has turned negative for the first time since 2012, and Oracle’s credit rating has been downgraded. Rating agencies admit they cannot see all the liabilities. The market, however, has delivered its verdict: AA-rated borrowers trade at spreads of around 140 basis points, wider than those on lower-rated global IG credit.
The risk is not a bubble bursting, but a reset of expectations. A 1–4% fall in US investment, coupled with modestly wider credit spreads, would shave around one percentage point off US GDP by mid-2027, and almost two off South Korea’s, according to Bloomberg’s “SHOK” model. With oil prices, tariffs and immigration restrictions already pushing prices higher, the cocktail would have a distinctly stagflationary flavour.
D. Trust: a new factor of production
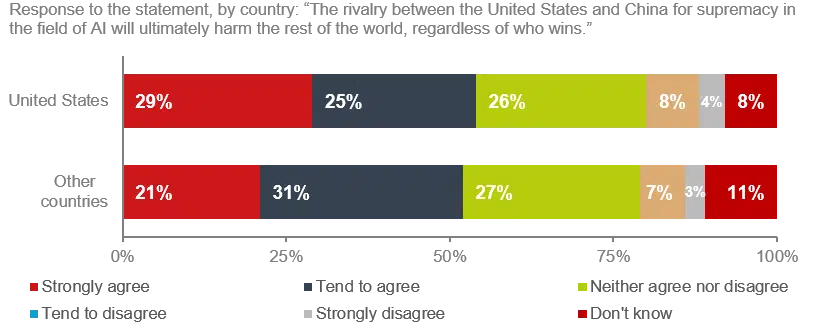
The AI race is also a source of concern in the United States
Sources: Accuracy, FGS Global
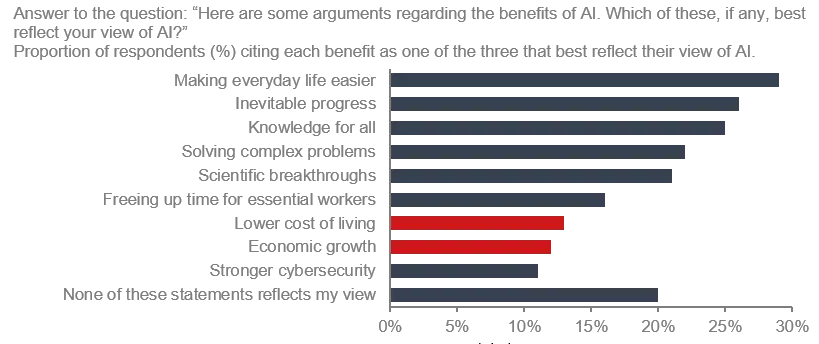
Macroeconomic arguments appear less convincing than AI’s tangible benefits
Sources: Accuracy, FGS Global
That leaves the most underestimated variable: public acceptance. AI is widely used, yet only 18% of people view it favourably (fewer than for social media) and just 7% trust self-regulation. Delegating tasks to agents requires knowing them as a bank knows its customers: a shift from Know Your Customers to Know Your Agents. Who authorises them, what permissions do they have, and who is accountable for their mistakes?
There is no need to replicate banking supervision. But its risk-management principles transfer directly: individual accountability, control of dependence on a single supplier, stress tests and a speak-up culture. The winners will probably be neither the fastest nor the most cautious, but the best governed.
The stakes extend beyond business. Around 60% of jobs in advanced economies could be exposed. Asia is already seeing a 10% fall in demand for workers in the most affected occupations, while data centres will consume more electricity in 2030 than Japan does today. When a model can identify almost three-quarters of pancreatic cancers up to three years before diagnosis, the promise is tangible. But the bill must not deter those expected to pay it.
Bond markets
From safe haven to the periphery: France faces the test of long-term yields
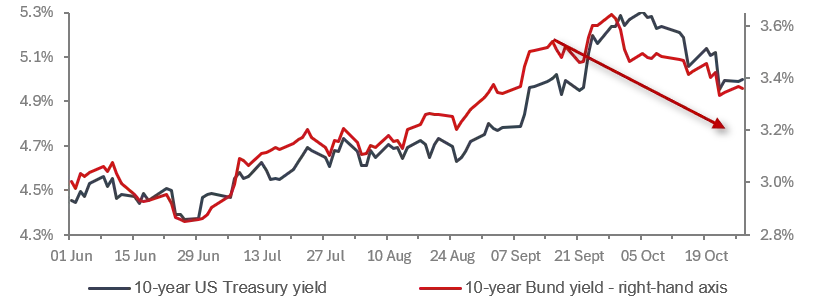
As caution towards AI returns, safe-haven assets move to the fore
Sources: Accuracy, Bloomberg
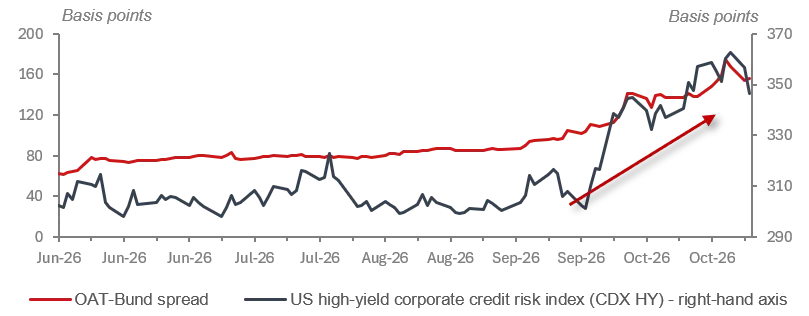
French OATs clearly sit outside the safe-haven category
Sources: Accuracy, Bloomberg
In September, US government bonds suffered their worst month in almost two years. By October, they were once again a haven for anxious capital. Between surging oil prices and doubts about artificial intelligence, investors are redrawing the map of safe assets, and France seems to be gradually disappearing from it.
A. A global search for safety
Two shocks are overlapping. The conflict in the Middle East and recent attacks in Saudi Arabia are pushing up oil prices, even as flows through Hormuz return to normal. Fears of prolonged inflation could prompt central banks, particularly in the Eurozone and the United States, to maintain a tougher stance.
Meanwhile, with nearly $2 trillion invested in AI this year, markets are questioning its profitability. Whenever doubts about either intensify, capital flows back into safe havens, such as US Treasuries and the Swiss franc.
That is a welcome reversal for the United States after several weeks in which fears of persistent inflation drove up long-term yields. What comes next? Much will depend on whether oil prices or the AI market gains the upper hand.
B. France: between systemic forces and market mechanisms
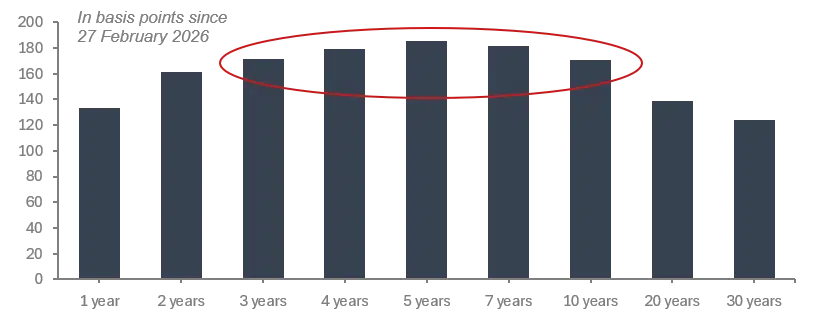
France: average maturities reflect pressure on bond yields
since the start of the war in Iran
Sources: Accuracy, Bloomberg
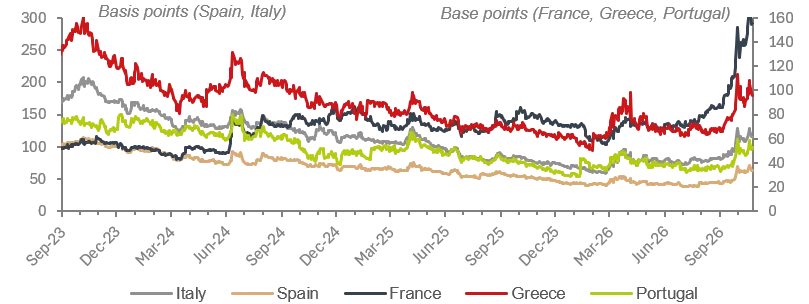
Euro area: the risk premium on European bonds shows signs of
contagion from France
Sources: Accuracy, Macrobond
France seems to be losing out in this reshuffle. Its spread over the German Bund reached 170 basis points in late October, a level not seen since 2011. France borrows at higher rates than Italy, and its ten-year real yield exceeds that of the United States. Once a “core” or “semi-core” country, it is joining the periphery.
Fundamentals weigh heavily. With a fiscal deficit of around 5.3% of GDP in 2026 and roughly 5% in 2027, France remains a problem child for the Eurozone.
Politics darkens the picture further: four different governments since the dissolution of parliament in 2024, anger on the streets and the approaching 2027 presidential election, with promises ranging from ECB intervention to the cancellation of some of the debt it holds.
France’s predicament spills beyond its borders. But is it really Europe’s “canary in the coal mine”? France is not the first country hit by the cost-of-living crisis, and Germany, too, reflects the erosion of the political centre. France nevertheless seems above all to be a source of contagion: in one month, Belgian, Greek and Spanish spreads over the German Bund widened by 15–25 basis points.
Blaming the budget alone would be too simplistic, however. Some of the pressure is mechanical. Hedge funds’ share of Eurozone sovereign bond trading rose from 26% to 56% between 2018 and 2023. They use borrowing through the repo market to finance their positions. When bond prices fall, margin calls force them to sell their most liquid holdings, starting with French government bonds (OATs) in the two-to-five-year and ten-year maturities, which have suffered most since January.
European high-yield corporate credit risk index (iTraxx
Crossover) across maturities
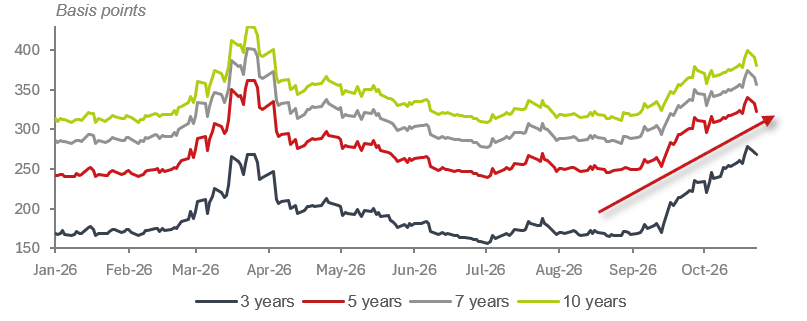
Sources: Accuracy, Bloomberg
OAT-Bund spread across maturities
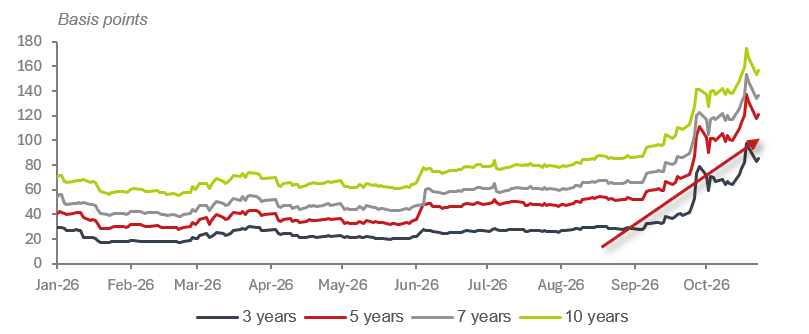
Sources: Accuracy, Bloomberg
C. How should the ECB respond?
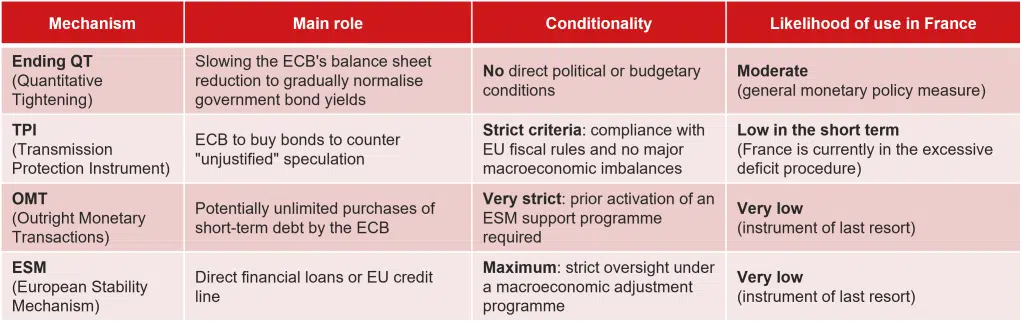
In focus: do external economic and financial imbalances start at home?
External imbalances are not just about international trade. They primarily reflect domestic balances between saving, investment and economic policy choices. In the United States, low saving and fiscal deficits feed a current-account deficit financed by the dollar’s enduring appeal. In China, excess saving, the priority given to industrial supply and weak domestic demand are fuelling a growing external surplus. In the Eurozone, the surplus chiefly reflects a shortfall in productive investment and savings that are not being put to work. If these imbalances persist, they could weaken the global economy. International co-ordination is needed to avert a crisis.
External imbalances are a recurring theme in today’s economic debate. First came the tariffs imposed by the Trump administration on the rest of the world, in response to a merchandise trade deficit that has been widening for decades: from $174 billion in 1995 to $1,260 billion in 2025, or 2.3% and 4.1% of GDP respectively. The cause, of course, could only be unfair behaviour by America’s trading partners.
Then there is the Chinese authorities’ overtly mercantilist approach. Through a forced march backed by public subsidies, they are building a competitive industrial base geared to current needs. Unfortunately, domestic demand is not keeping pace. Exports are therefore growing relatively rapidly: by 17% in 2024 and 9% in 2025, compared with global growth of 4.6% and 4.4%. All that output has to go somewhere.
Prices charged to foreign customers have played their part, falling by 14% over the three years from 2023 to 2025. Imports, meanwhile, have lagged: growth of 0.1% and 1.6%, against global increases of 3.2% and 4.0% respectively.
And where does that leave the Eurozone? More restricted access to the US market and sluggish Chinese demand can only hurt. Net trade detracted from economic growth in 2025, subtracting 0.6 percentage points from GDP growth of 1.4%, and the trade surplus is shrinking.
A look at current-account statistics puts these developments into perspective.¹ America’s deficit is clearly widening: from around 2% of GDP in 2018 to nearly 4% in 2025. Over the same period, China’s balance moved from equilibrium to a surplus of almost 4%.
The Eurozone shows less of a clear trend in either direction. Barring international crises – notably the shock from Russia’s invasion of Ukraine in 2022 and the time needed for energy markets to normalise – its surplus has hovered between 2% and 3% of GDP for some time. Exports have slowed but so have imports. And although relations with China are deteriorating, those with the United States are holding up, thanks to the chemicals sector in 2025, while ties with the rest of Europe are strengthening.
More broadly, taking other regions into account, these imbalances are both substantial and persistent. They are a source of vulnerability for the international economy.
This snapshot does not tell the whole story. Today’s trade tensions certainly affect current accounts, but they do not explain everything. To understand external imbalances more fully, we need to examine the macroeconomic and macrofinancial conditions within each of these regions. Let us start with a few accounting equations:
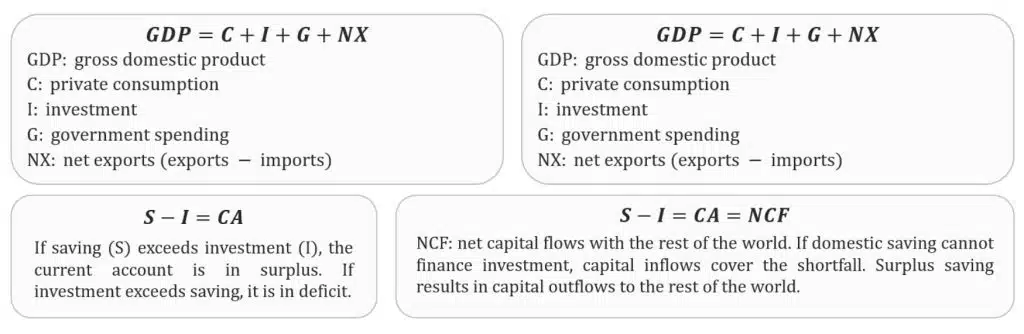
The path of a country’s or a region’s external balance is therefore shaped by three forces: its economic growth relative to the rest of the world, whether cyclical or structural and allowing for policy initiatives; the domestic balance between saving and investment; and the relative appeal of different destinations to investors and providers of finance. The last two deserve particular attention.
In the United States, low household saving and the persistent widening of the fiscal deficit are pushing down the national saving rate, even as investment holds up, albeit with shifts between its components. The persistent, and perhaps growing, external deficit has prompted no corrective policy response. This is probably because the strength of the US economy and its continuing safe-haven status (for now?) make it easy to finance the gap between national saving and domestic investment. Can this widely shared attitude of “benign neglect” last?
In China, the overriding priority is to move manufacturing and technology up the value chain, without entirely relinquishing positions in more traditional markets. Competition between provinces helps sustain a brisk pace of activity in the sectors concerned.
Beijing’s policy choices – a reluctance to strengthen social protection even as households contend with a lacklustre labour market and a deep property crisis – hold back domestic demand. There is little real appetite for significant stimulus. These choices encourage saving and push companies to seek abroad the customers they struggle to find at home. The external surplus thus looks both enduring and set to grow. How long will the rest of the world accept this?
Europe likes to see itself as standing apart from this US–China dynamic. Yet a Eurozone current-account surplus of between 2% and 3% of GDP, with few exceptions, for many years cannot go unnoticed, particularly when individual members, such as the Netherlands and Germany, run surpluses of around 8% and 4% of GDP respectively.
In fact, the “old continent” suffers from inadequate supply-side policies. Productivity gains, and hence economic growth, are weak. An atmosphere of anxiety encourages saving and discourages investment. Savings not deployed at home seek better returns abroad, while insufficient capital spending prevents a productivity revival. This lopsided relationship between saving and investment feeds a vicious circle that constrains economic activity. It urgently needs to be addressed.
These three cases leave an uncomfortable impression of an equilibrium that looks stable but could unravel. Will it really last? In each case, the policy mix seems less than optimal. The United States would be well advised to put its public finances in order and encourage households to save more before foreign investors decide that their exposure to dollar assets is excessive, disappointing, or both.
In China, the balance between an all-out industrial policy and a parsimonious approach to social protection looks fragile.
In Europe, creating the conditions for more productive investment, and mobilising available domestic savings to finance it, has become imperative.
Doing nothing, or acting too late and without sufficient co-ordination, risks triggering an economic and financial crisis. History offers a reminder:
- 1920s: American capital flows to Europe financed public spending rather than productive investment, contributing to the collapse of the financial system;
- 1970s–1980s: oil exporters’ surpluses were recycled into developing countries, leading to a debt crisis, notably in Mexico in 1982;
- 1980s: imbalances between the United States and Japan led to trade tensions and exchange-rate adjustments under the Plaza Accord, followed by a financial bubble in Japan;
- 2008–2009 global financial crisis: global imbalances, particularly the US deficit, were linked to domestic factors such as the housing bubble and a highly accommodative monetary policy. The crisis began in the United States and quickly spread worldwide.
By contrast, the final decades of the 19th century and the early years of the 20th, before the first world war, provide an example of European savings being productively recycled into investment in the “new world”: the United States, but also Canada, Argentina and Australia.
It would certainly be wise to recognise that neither the large saving–investment imbalances in each of the three regions examined here, which clearly do not all run in the same direction, nor the scale and geography of international capital flows, much of them towards the United States, are necessarily sustainable. That is especially true in a geoeconomic environment marked by trade tensions and rising protectionism.
The rise of artificial intelligence (AI), and America’s lead in the field, do offer hope that capital will continue to pour into the United States, while domestic savings in China and Europe will inevitably be tapped to fund the investment needed for large-scale AI deployment.
Two caveats remain: these dynamics may not be compatible, and AI’s promise of a brighter economic future is far from guaranteed.
If, once again, prevention is better than cure, some international co-ordination of economic policies across regions would be useful, involving:
- in the United States, higher national saving to reduce dependence on foreign financing;
- in China, a rebalancing of excess saving, with economic growth driven less by exports and more by domestic consumption;
- in Europe, higher investment in infrastructure, defence, technology and the green transition, financed largely by domestic savings.
Will today’s geopolitical climate allow such a joint course? The historical episodes outlined above offer at least two important lessons:
- rebalancing must be collective, but it is asymmetric: it requires greater effort from deficit countries than from surplus countries. Moreover,
- economic policy must do the heavy lifting. Trade measures, such as the tariffs favoured by President Trump, are ill-suited to the task, as more than a year’s experience in the United States illustrates. Co-ordinated initiatives are needed to alter domestic demand or tighten or ease financial conditions, depending on each country’s circumstances.
Let us go a little further. Exchange rates are among the policy tools that might be deployed. Could there be a repeat of the 1985 Plaza Accord, agreed by Germany, the United States, France, Japan and the United Kingdom to bring down the dollar? The US currency, then clearly overvalued, lost some 30% of its value in just over two years, measured against all currencies and adjusted for inflation differentials. It is hard to envisage a response in the affirmative.
For one thing, China would probably be reluctant to take part in an operation to strengthen the yuan when export growth is compensating for weak domestic spending. And with $3.4 trillion in foreign-exchange reserves, it has the means to defend its currency, does it not?
For another, persuading the global foreign-exchange market to follow official decisions could prove difficult. The market has simply become enormous, with $12 trillion in daily transactions: 60 times the level of 40 years ago, while world GDP in current prices has increased ninefold.
Nor should we overlook America’s likely reluctance to accept a weaker dollar. Might that open a Pandora’s box, forcing a rapid fiscal tightening and efforts to encourage household saving, to reduce dependence on foreign capital made less keen on US assets by currency risk?
Hervé Goulletquer, Senior Economic Adviser, Accuracy
Two lessons in economics: arithmetic is stubborn,