
Economic conditions: a pointillist picture that demands a closer look
Despite persistent geopolitical uncertainty and stubborn price pressures, economic growth is holding up, and the second half-year could prove stronger than the first. Yet this broadly reassuring picture should not obscure the hierarchy of performance: the United States is outpacing the Eurozone, and France is faring particularly poorly within it.
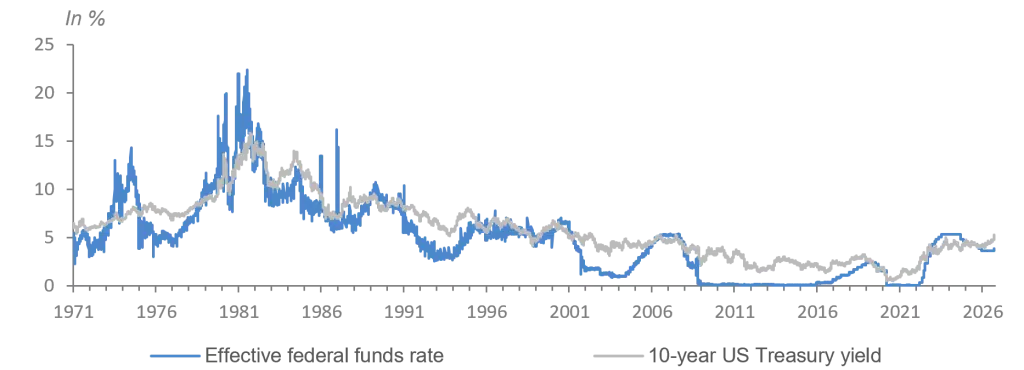
Although US monetary policy is reassuring (a point that could be extended to other initiatives managed from Washington), the widespread pressure on long-term interest rates calls for vigilance. It should be read, at least in part, as a demand for greater fiscal responsibility. Otherwise, beware: vae victis!
Global economic conditions
Encouraging PMI surveys in September
United States: activity growing at its fastest pace in five years,
but prices warrant caution amid surging costs
Sources: Accuracy, S&P Global, Macrobond
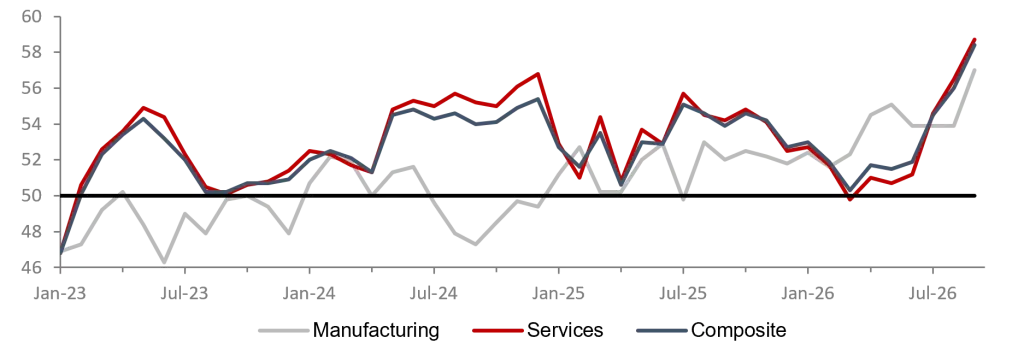
In the United States, September’s PMI surveys point to a marked acceleration in activity, but at the cost of renewed inflationary pressure. The composite index rose from 56.0 to 58.4, its highest level since July 2021, driven by strong services activity and, increasingly, firmer manufacturing output. Demand remains chiefly supported by the domestic market and has been accompanied by a clear rise in employment. Yet the upturn is also exposing mounting supply constraints: growing order backlogs, longer delivery times and pressure on productive capacity. Against this backdrop, the recent rise in energy and transport costs, combined with stronger wage pressure, has pushed firms’ input-cost inflation to its highest level since October 2022.
Eurozone: activity is expanding despite the threat
from energy prices
Sources: Accuracy, S&P Global, Macrobond
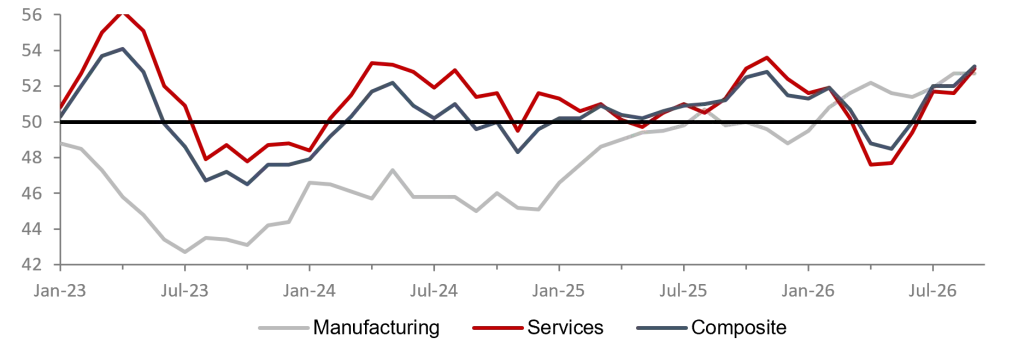
In the Eurozone, the recovery strengthened in September. The composite PMI rose from 52.0 to 53.1, its highest since April 2023, supported by faster growth in new orders and a rebound in services, while manufacturing activity continued to expand. The improvement confirms firmer conditions in the third quarter, when the composite PMI averaged 52.4, up from 49.1 in the second quarter. The rebound is generating few jobs, however, and has come with renewed inflationary pressure. Higher energy prices are driving a marked increase in firms’ costs and, to a lesser extent, selling prices.
China: signs of improvement
Sources: Accuracy, S&P Global, Macrobond
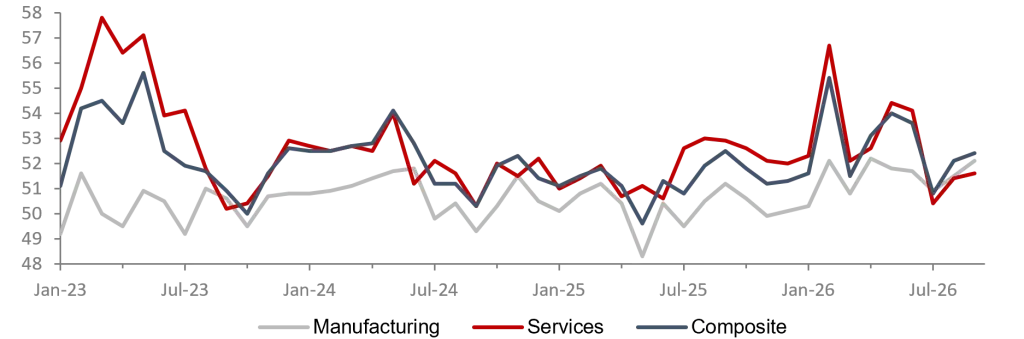
In China, manufacturing activity accelerated in September, with the RatingDog PMI rising from 51.5 to 52.1, its highest level in five months and its tenth consecutive month in expansionary territory. The improvement reflected faster growth in output and new orders, supported by both domestic and external demand, while employment returned to modest growth. Stronger activity nevertheless brought renewed cost pressures, notably from higher metals and oil prices, prompting manufacturers to raise selling prices again. Business confidence also improved, although it remained below its historical average.
Eurozone inflation: a closer look at food
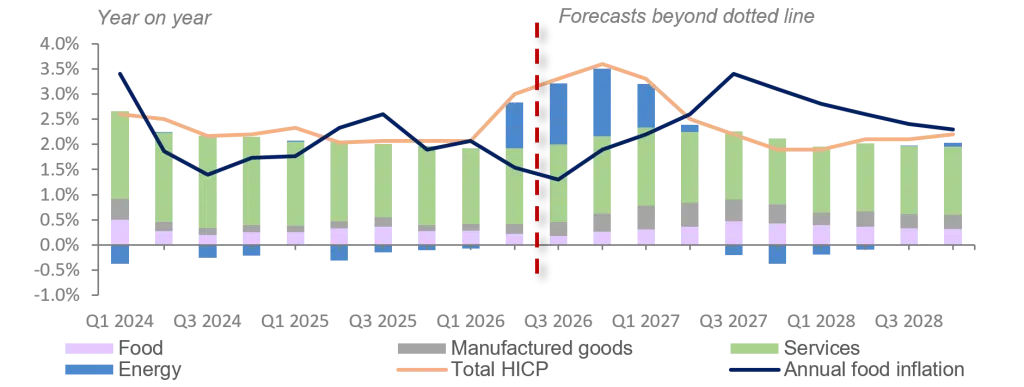
Food inflation is set to rebound as climate and energy pressures mount
After its recent easing, food inflation is expected to rise again from late 2026, reaching 3.4% in the third quarter of 2027. Three forces are at work: weather and climate disruption, poorer harvests and the gradual pass-through of the energy shock into production costs.
1. European harvests are highly exposed to climate shocks
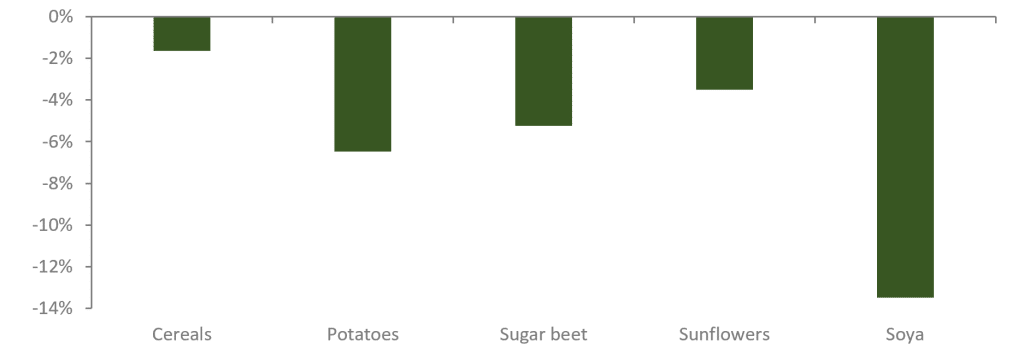
Summer heatwaves and drought have already led to a sharp downward revision in European crop yields. According to European Commission forecasts, yields will be around 7% below their five-year average, though losses vary greatly by crop. Overall, weaker harvests could lift food prices in the EU by roughly 1–3%.
The development of an exceptionally powerful El Niño, probably the strongest since the 1960s, could add substantially to global food prices, though its effects will differ by product and region. The southern United States, for example, is receiving more rainfall, while central and northern areas are experiencing more drought, as in Europe. Overall, the effect is likely to be inflationary for coffee and cocoa, but disinflationary for soya beans.
Difference (%) between forecast agricultural yields for summer
2026 and the five-year average yield (t/ha)
Sources: Accuracy, European Commission
Contributions to quarterly inflation and forecasts
Sources: Accuracy, ECB, Eurostat, Macrobond
2. Three complementary channels of price transmission
1) Lower yields: smaller harvest volumes tighten available supply and increase price volatility.
2) Higher input costs: the rise in energy prices following the conflict in Iran directly raises the cost of producing current harvests, notably through increases of as much as 50% in some fertiliser prices just as the sowing season begins. It also raises transport, packaging and other intermediate costs indirectly. Some businesses remain protected by energy contracts signed before the conflict, delaying the pass-through until those agreements expire.
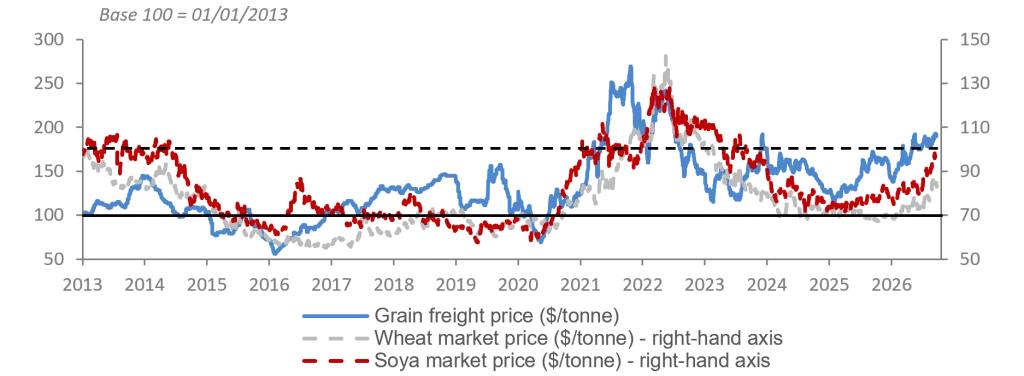
3) The return of bottlenecks: container freight rates have roughly doubled since April, although they remain below both the pandemic peak and the 2024 high. Exceptionally low water levels on the Rhine and Danube are partly to blame, as are drought-related restrictions in the Panama Canal, while disruption in the Bab el-Mandeb and Hormuz straits continues.
What can be done to respond to food inflation?
3. Potential buffers against a repeat of the 2022–23 surge at the start of Russia’s war in Ukraine
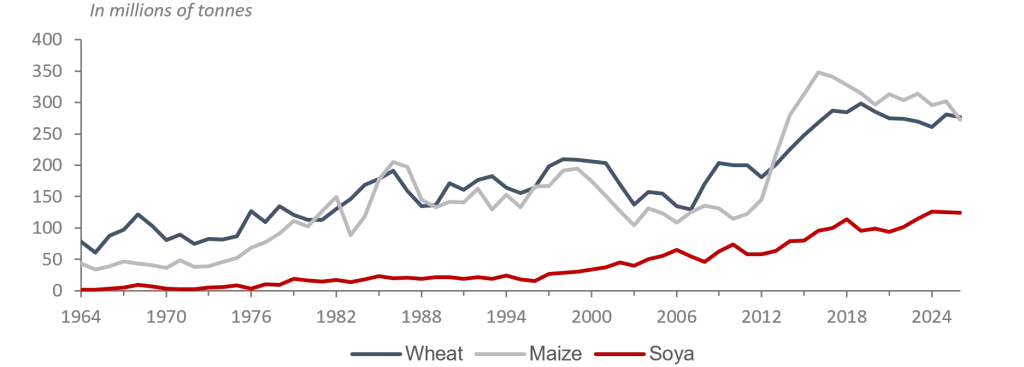
1) Global grain stocks, particularly of wheat and rice, remain high and can absorb part of the production shortfall.
2) A large share of agricultural commodities is bought forward rather than on spot markets, slowing the pass-through of price increases.
3) Retailers appear more willing to compress their margins than to pass the full increase in costs on to consumers immediately.
Global grain stocks remain at historically high levels
Sources: Accuracy, USDA, Macrobond
Grain price indices are rising, notably because of sea freight costs
Sources: Accuracy, IGC, Macrobond
4. What should governments do?
Access to food is first and foremost a socio-economic public-health issue, reflected in income inequality. In many countries, food accounts for more than half of household budgets. Before intervening to support households, the IMF proposes a three-question diagnostic for public authorities:
1) Is the supply chain functioning properly?
2) How is household purchasing power being affected?
3) Can vulnerable households be supported?
Where food is available but has become too expensive, targeted cash transfers or food vouchers are preferable to broad subsidies because they concentrate support on the households most exposed. Although easy to deploy, general subsidies are costly, poorly targeted and benefit better-off households first, since they consume more. Where the problem is the physical unavailability of food because harvests have been destroyed or logistics networks disrupted, in-kind food transfers become necessary. They should nonetheless remain temporary so as not to weaken demand.
Monetary policy
The ‘Becket effect’, or the political illusion of controlling money
A historical perspective on the relationship between political will and monetary reality.
A. The political gamble
Political leaders appoint central-bank governors in the hope of extending their influence into the heart of monetary policy. Yet once in office, those appointees discover a role governed by the unforgiving logic of monetary constraints and their institution’s mandate. A comparison between Donald Trump’s America and Helmut Schmidt’s Germany sheds useful light on this relationship.
Just as Donald Trump promoted Kevin Warsh to lead the Federal Reserve with the mid-term elections in mind, Helmut Schmidt had backed Karl Otto Pöhl’s rise to the presidency of the Bundesbank in the early 1980s. Schmidt believed he could rely on a former colleague to champion monetary easing and support the economy by lowering the cost of credit and investment. But the duty to safeguard monetary stability, incumbent on the central-bank president at a time when the Deutsche Mark was weak against the dollar and Paul Volcker’s Federal Reserve was tightening policy, soon trumped personal ties and imposed its own discipline, impervious to political pressure.
B. The monetary constraint
Faced with persistent inflation risk, Kevin Warsh now appears to be rediscovering this same grammar. The job is not to carry out the government’s preferences, but to preserve the credibility on which inflation expectations, long-term interest rates and, more broadly, the stable financing of the economy depend.
All this is a reminder that imposing an accommodative monetary policy when circumstances call for the opposite fuels inflationary forces and drives up long-term interest rates. Monetary policy cannot be bent to political will without markets eventually exacting a price.
Schmidt’s experience also shows how far this contradiction can go. His repeated calls for lower rates, right up to the final weeks of his government, met with the central bank’s unyielding resistance. The easing he sought came only after he had left office.
C. The reversal
This reversal is an instance of what is known as the ‘Becket effect’, after Thomas Becket, Henry II’s former chancellor, who became the king’s adversary after being appointed Archbishop of Canterbury. Expected to help assert royal supremacy over the English Church, Becket instead fought, once appointed, for the Church’s complete exemption from civil jurisdiction and therefore from any subordination to central authority.
At heart, this historical lesson reveals a fundamental asymmetry between political time and monetary time. The former is driven by the need to deliver visible results before the next election; the latter is governed by the test of credibility.
It should nevertheless be remembered that Becket was murdered, with the king’s complicity. So…
Allowing for the obvious differences, monetary independence from political power can never be absolute. Central banks are themselves public institutions and must justify their economic choices. Resistance is certainly a virtue, but here it is more human in origin than theological or divinely inspired. The constraints of the relative ultimately prevail over the pursuit of the absolute.
United States: raising rates – and policymakers’ credibility
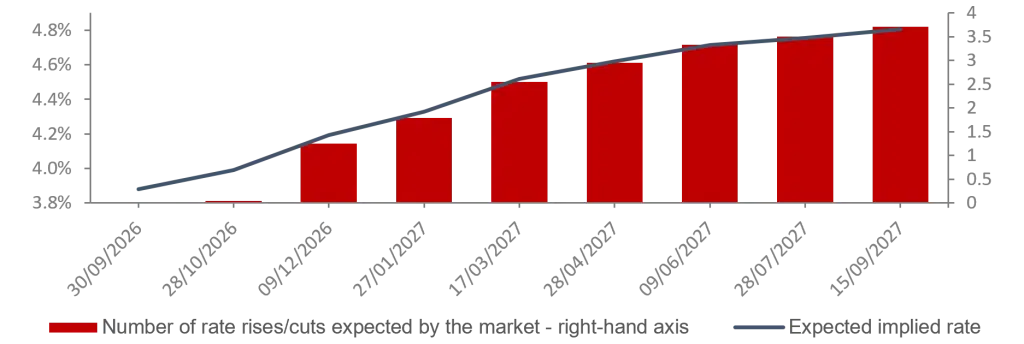
The cycle of US policy-rate cuts that began in 2023 ended at the third meeting of the Federal Open Market Committee chaired by Kevin Warsh. The Federal Reserve unanimously raised its policy rate by 25 basis points, to a target range of 3.75–4%. The tightening comes while the economy remains robust and the labour market close to full employment, but with inflation having remained ‘too high for too long’. The US central bank has a dual mandate: to maintain price stability and full employment. In these circumstances, the second objective does not conflict with the first, leaving the Fed free to concentrate on inflation.
Close to the Trump administration and having arrived at the Fed under a cloud of suspected political dependence, Kevin Warsh needed quickly to show that he would not simply transmit the president’s preference for low rates. By backing a rate rise that a majority of the FOMC would probably have adopted even without him, the Fed chair preserves his stock of credibility on two fronts: within the committee, by placing himself at the centre of the consensus; and with markets, by demonstrating that the Fed’s reaction function remains guided by macroeconomic data.
The decision can also be read through its impact on the yield curve. Raising the policy rate mechanically pushes up its short end. At the same time, by convincing investors that the Fed will not allow inflation to become entrenched, it can reduce the inflation risk premium and stabilise or even lower long-term yields. The Treasury Department and its secretary, Scott Bessent, can only welcome that outcome.
Market expectations for US monetary policy decisions
Sources: Accuracy, Bloomberg
United States: the policy rate rise also signals vigilance over
pressure on long-term rates
Sources: Accuracy, Macrobond
Finally, the decision confirms the profile of a central-bank chair who is probably more narrative-driven than framework-driven: more inclined to construct a coherent account of present conditions than to adhere to a rigid rule or predetermined path.
The French economy: growth and inflation in the European context
Activity lagging behind
- A first half-year that tested the economy’s resilience to the limit…
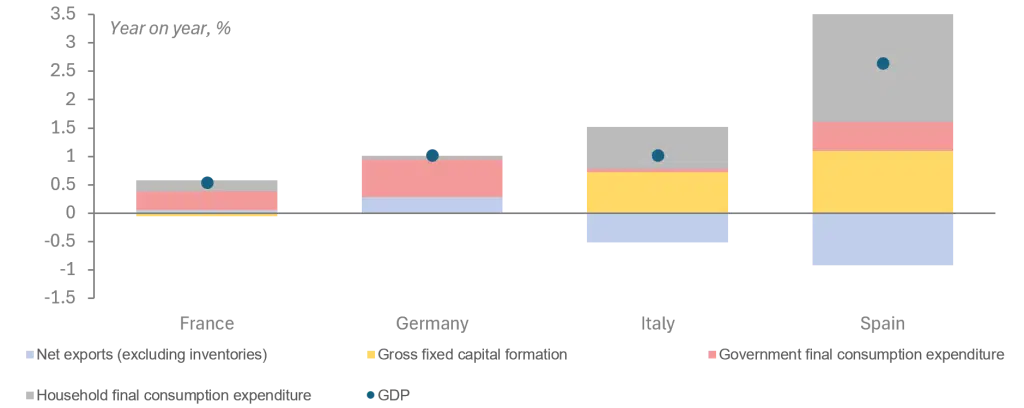
While Germany, Spain and Italy managed to maintain growth rates as strong as in the first quarter (0.3% quarter on quarter in Germany, 0.6% in Spain and 0.2% in Italy), France compares poorly. It recorded no growth in the second quarter, while annual growth was an uninspiring 0.5%.Every engine of domestic demand appears to be misfiring: private consumption is stagnant, public consumption spending is weaker than in neighbouring countries, and fixed-capital investment is being held back by public procurement, with the municipal spending cycle only just beginning. By contrast, Italy’s and Spain’s infrastructure performance reflects the final grants from the EU recovery fund. Even so, the positive contribution from net trade highlights the cyclical difference between France and its southern neighbours.
Eurozone: contributions to GDP growth in the
second quarter of 2026
Sources: Accuracy, Eurostat, Macrobond
- …while the second half-year is showing signs of improvement
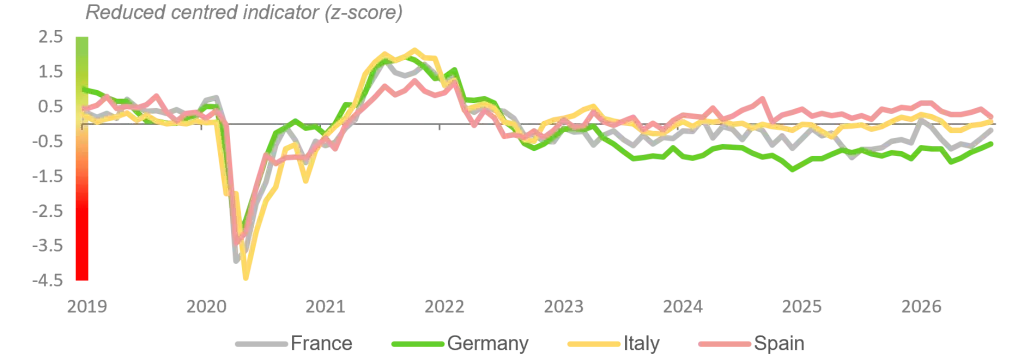
Although economic conditions have deteriorated sharply amid the continuing conflict in the Middle East, the indicators (business sentiment and economic confidence) are gradually recovering towards levels seen at the start of the year. On the back of this tentative improvement, activity could grow by 0.2% in the autumn.
Sectoral performance is nevertheless likely to remain uneven. Manufacturing output is expected to fall sharply in the third quarter (-0.6% quarter on quarter), weighed down by summer disruption in the automotive industry, maintenance shutdowns in refining and episodes of extreme heat, before rebounding towards the end of the year. Aerospace should be a bright spot, accelerating markedly in the fourth quarter and growing by almost 10% over the year. Construction is likely to remain under pressure (-0.4% quarter on quarter in the third quarter), particularly in public works, before stabilising in the autumn. Finally, after a slight summer decline, agriculture should support growth towards year-end as crop production recovers, assuming yields gradually return closer to normal.
Eurozone: economic confidence indicator
Sources: Accuracy, DG ECFIN, Macrobond
Lower inflation than its neighbours
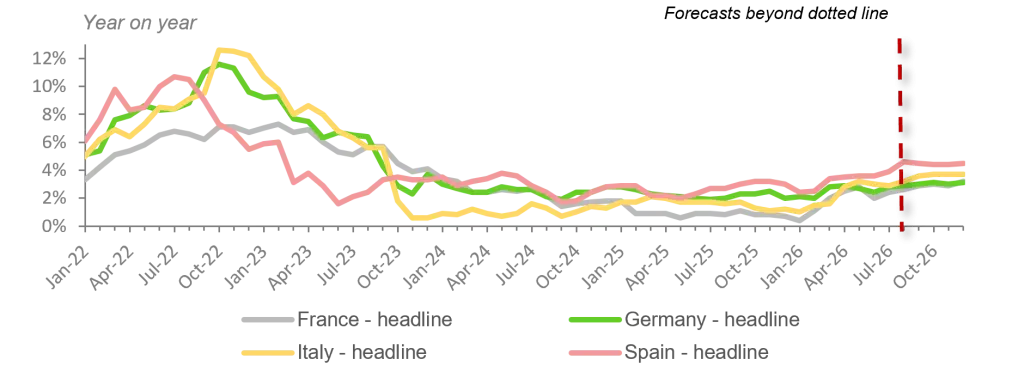
Inflation differentials among the Eurozone’s major economies are expected to remain pronounced throughout the second half. According to INSEE (see its September 2026 economic outlook), headline inflation is projected to reach 4.5% in Spain by year-end, 3.8% in Italy and 3.1% in both Germany and France, well above the 2% target. The divergence would be even clearer after excluding volatile components such as energy, food, tobacco and alcohol. On that basis, core inflation would stand at 3.8% in Spain, 2.8% in Germany and 2.1% in Italy. With wages rising more slowly than in neighbouring countries, France would bring up the rear, with core inflation of 1.8%, below target.
Eurozone: harmonised consumer price index
Sources: Accuracy, Eurostat, Macrobond
Eurozone: harmonised core inflation index
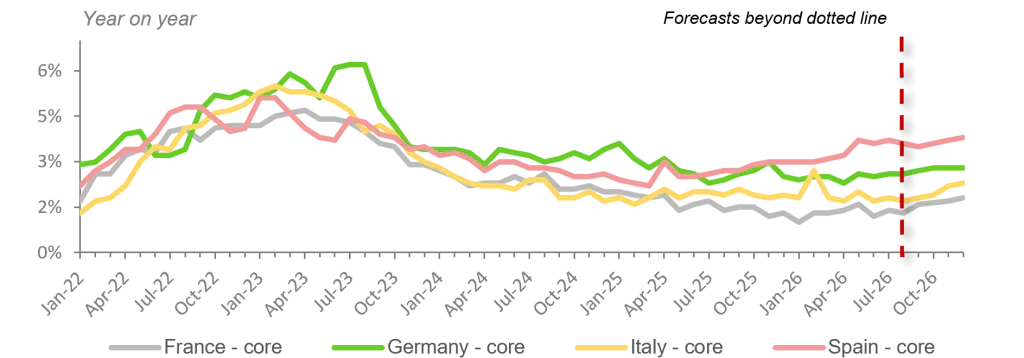
Sources: Accuracy, Eurostat, Macrobond
In France, the acceleration was particularly marked in September. According to INSEE’s latest estimate, CPI inflation reached 3.0% year on year, up from 2.4% in August, while HICP inflation, the measure harmonised across the EU, rose from 2.6% to 3.4%. The increase was driven first by a renewed acceleration in energy prices, led by petroleum products and gas, but also by firmer food inflation, particularly for fresh produce, and a slight pick-up in services inflation. The decline in manufactured-goods prices also moderated.
France: an unflattering set of economic figures for 2026
Weak growth, declining household purchasing power and a falling corporate profit margin.
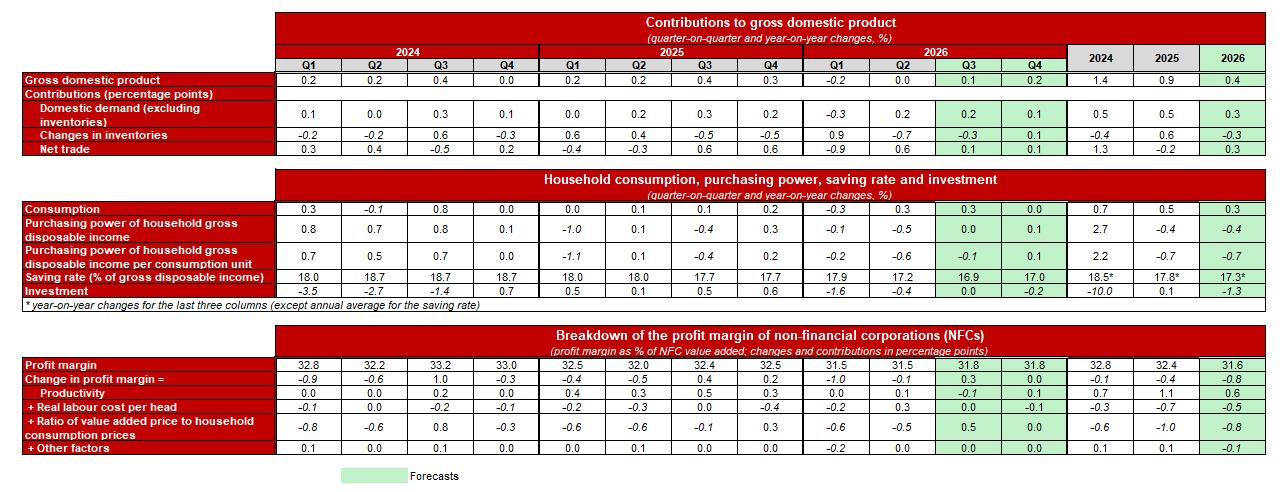
Sources: INSEE Economic Outlook, September 2026
Germany: the economic and political outlook
Behind the growth rebound, the traditional engines continue to stall
After growth of just 0.3% in 2025, German GDP is expected to expand by 1.2–1.4% in 2026, before slowing to around 1% in 2027 and 0.7–0.8% in 2028. Yet this near-term recovery does not signal the restoration of the country’s industrial and export-led model. Medium-term potential growth is now estimated at only 0.3% a year, reflecting a shrinking labour force and insufficient productivity gains.
Germany: contributions to quarterly real GDP growth

Sources: Accuracy, Eurostat, Macrobond
The 2026 rebound is explained primarily by the stimulus programme implemented by the federal government since 2025 and remains concentrated in sectors directly supported by that fiscal impulse. A 2% rise in exports, notably in chemicals and petroleum products, contributed 0.3% to GDP growth in the first quarter and 0.33% in the second. At the same time, private consumption grew by only 0.1%, while investment in equipment fell by 1.4%. Employment declined for a fourth consecutive quarter, with around 50,000 jobs lost between April and June. Finally, manufacturing, which has struggled for several years, is showing signs of improvement: value added rose by 0.9% year on year in the second quarter of 2026, the first increase since 2022. Leading indicators confirm the trend. The manufacturing PMI climbed to 54.3 in August 2026, from 49.8 a year earlier, while new orders recovered sharply, driven mainly by domestic demand.
Growth is thus becoming more dependent on the state. Fiscal measures will amount to €33bn–40bn in 2026, followed by €23bn–27bn in 2027. Infrastructure and defence spending are supporting construction, capital goods and dual-use sectors such as electronics, optics and vehicles. In 2026, the fiscal impulse is expected to add around 0.8 percentage points to GDP growth, followed by a further 0.6 points in 2027.
Germany: the composition of investment is changing, but overall
momentum remains weak

Sources: Accuracy, Destatis
Germany has therefore not rediscovered its former engine of growth. Behind manufacturing’s cyclical recovery, the economy continues to face structural challenges, while activity is increasingly sustained by public investment and defence spending. From 2028, the announced reforms of the health and pension systems could even offset some of the benefits of the current stimulus.
As rearmament reshapes industry, what becomes of the political and social compact?
Faced with the ‘China shock’ threatening high-quality jobs in the automotive industry, defence offers a conversion path for part of German industry, one of the few sectors capable of rapidly absorbing existing industrial skills. Yet this transition is not enough to pull the whole economy along. Total employment is expected to fall by a further 190,000 or so in 2026, while unemployment remains between 6.3% and 6.4%. With inflation forecast at 2.7–2.8%, followed by 2.6–3% in 2027, purchasing power would improve only slightly. Private consumption is therefore likely to remain sluggish even as public spending accelerates.
The stagnation in industrial production is not solely due to the loss of
access to Russian gas: it also has structural causes

Sources: Accuracy, Destatis, Macrobond
Manufacturing new orders
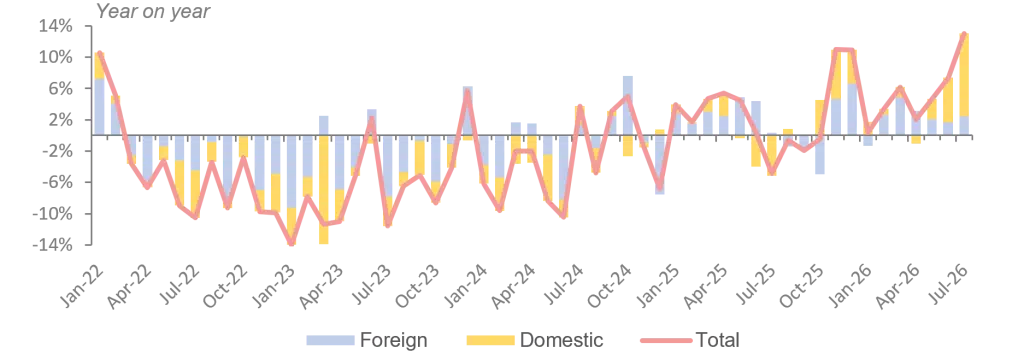
Sources: Accuracy, Destatis, Macrobond
This mismatch is producing a two-speed recovery. The state is supporting strategic companies and infrastructure, while households continue to bear the cost of restructuring, high prices and job uncertainty. Inequality in labour income has edged up since 2023, as middle- and higher-income earners have benefited more from wage catch-up than those on lower incomes. Improving macroeconomic conditions therefore coexist with a persistent sense of relative decline.
This discontent is particularly visible in eastern and rural regions. In Saxony-Anhalt, the AfD won 43.8% of the vote on 6 September 2026, against around 17% for the CDU. The state accounts for only 1.8% of German GDP, but the result points to a much wider political divide: reunification secured institutional convergence without erasing the feeling that eastern Germany had endured deindustrialisation and decisions imposed from the west. The pattern continued on 20 September 2026, when the AfD won 38.2% of the vote in Mecklenburg-Western Pomerania, ahead of the SPD on 35.5%; the latter is nevertheless expected to retain control of the regional executive by forming a coalition with other parties of the left. The most striking developments were the failure of Friedrich Merz’s conservative party to enter the state parliament, with less than 5% – a first in the post-war era – and the capture of Berlin by the radical-left Die Linke party, heir to East Germany’s former ruling party, with 25.7%, ahead of the CDU/CSU alliance on 18.8% and the AfD on 16.3%.
The divide is no longer confined to the former inner-German border. Support for the AfD is also growing in the west, increasingly setting metropolitan areas integrated into global trade against rural or peripheral regions. This geography of relative decline is compounded by questions over immigration, integration and the ability of institutions to control the transformations under way.
A more powerful Germany and one less easily anchored in Europe?
- Rearmament is transforming the scale of German power.
By 2027, defence spending could match the current combined total of France and the United Kingdom, before clearly surpassing it by 2030. This expansion comes as the United States scales back its commitment and Europe lacks both a unified command and a genuinely integrated defence industry.
The risk lies not in rearmament itself, but in how it is organised. Europe operates 174 major weapons systems, compared with 33 in the United States. If the new budgets remain national, they will strengthen a German industry already tempted to favour domestic companies without addressing Europe’s collective weaknesses.
For Berlin’s neighbours, a militarily dominant Germany that remains insufficiently integrated would revive a question that the post-war order had kept contained.
In response, the historic principle of ‘never again’ must now be complemented by ‘never alone again’. In other words, Berlin’s restored power must not be exercised independently of its partners: joint procurement, integrated defence industries and shared decisions on the deployment of forces, etc.
- The AfD’s advance makes this need for burden-sharing more urgent.
The party advocates a strong German army while rejecting the borrowing needed to finance it. It wants to reduce the European Union to co-operation among nations, challenges Germany’s American anchor and sees Russia as a potential partner for compromise.
The party’s perceived fiscal orthodoxy adds another apparent contradiction. If policy remains unchanged, the public deficit would rise from 3% of GDP in 2025 to around 4% in 2026 and 4.6% in 2027 under the stimulus plans. Meanwhile, debt would remain manageable, at between 68% and 71% of GDP in 2028. In practice, a rapid return to the debt brake, as proposed by the far-right party, would remove the economy’s principal source of support and also call into question the €500bn infrastructure financing plan, of which €100bn is to be deployed by the Länder and municipalities.
The AfD’s regional gains give it more scope to slow implementation of the investment plan, alter its priorities and strengthen its influence in the Bundesrat, which has a veto over certain budgetary matters. They also offer the party a laboratory in which to test its ability to govern and prepare more radical changes at national level. Conversely, maintaining the political firewall forces the established parties to form broader, more heterogeneous coalitions that are harder to manage in order to keep the AfD out of power. The extreme-right party is also pushing the CDU towards tougher positions on immigration, debt and the euro area. No matter what, the AfD benefits: either it normalises itself through the exercise of regional power, or it gradually imposes its themes on the centre-right while feeding the impotence of the coalitions formed to block it.
United States: from one economic era to another
Nominal GDP growth as the defining marker
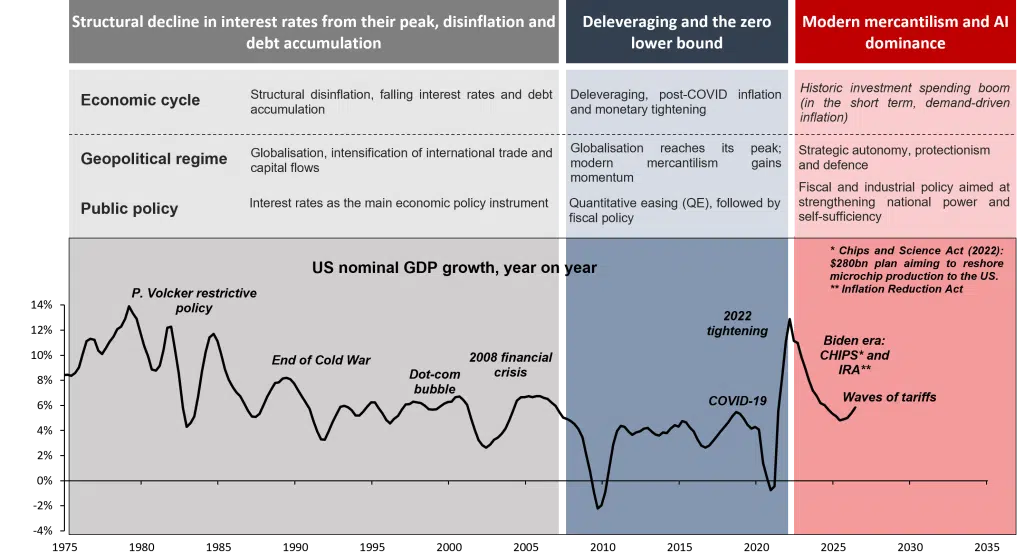
Sources: Accuracy, Bridgewater, Macrobond
Productivity and inflation
Supply shock versus demand: is the (dis)inflationary scenario credible?
The economic intuition that higher productivity automatically means lower inflation is correct only in partial equilibrium, that is, with prices and conditions in other markets held constant. A rise in productivity acts simultaneously on supply, by lowering marginal costs, and on demand, by raising expected income, consumption and investment.
1) In the short term, greater production efficiency makes it possible to produce more with the same quantity of inputs, increasing potential output and reducing marginal production costs. If companies pass this reduction on through prices, inflationary pressure eases.
This dynamic appears in the US data: over one year, a 2.2% increase in labour productivity absorbed part of the 3.7% rise in nominal hourly compensation (not adjusted for inflation), limiting growth in unit labour costs to 1.4%.
This easing does not, however, amount to a permanent reduction in the inflation rate. A one-off shock to the level of productivity must be distinguished from a persistent increase in its rate of growth. In the first case, the price level adjusts downwards after the shock, before inflation returns towards its target. The shock is transitory.
2) Over the medium term, the demand channel takes over. The efficiency shock permanently raises output growth. Households, anticipating higher permanent income, therefore increase consumption. Companies likewise invest more in anticipation of higher returns on capital. When technological diffusion is gradual, demand can rise before realised supply, turning a shock that initially lowers costs into an inflationary force.
In this context, the equilibrium variable is the natural real interest rate. Sustainably faster productivity growth raises expected income and investment demand, which can lift that rate. If the central bank does not tighten policy accordingly, however, the rate actually applied becomes too accommodative relative to the economy’s new dynamics. The result is a risk of higher inflation.
Productivity and profits
Lower costs, wider margins: who captures the productivity dividend?
- Good news on the supply side…
Labour productivity in the US non-farm business sector rose by 2.2% year on year in the second quarter of 2026. This improvement allowed output to increase by 2.5%, despite a rise of only 0.2% in hours worked. The supply-side diagnosis is therefore favourable: the economy is producing more without a proportionate increase in labour input. In the short term, the first dividend from this greater efficiency should be slower growth in production costs. In the second quarter of 2026, unit labour costs rose by only 1.4% year on year, after 0.4% in the first quarter, among the lowest rates since 2023.
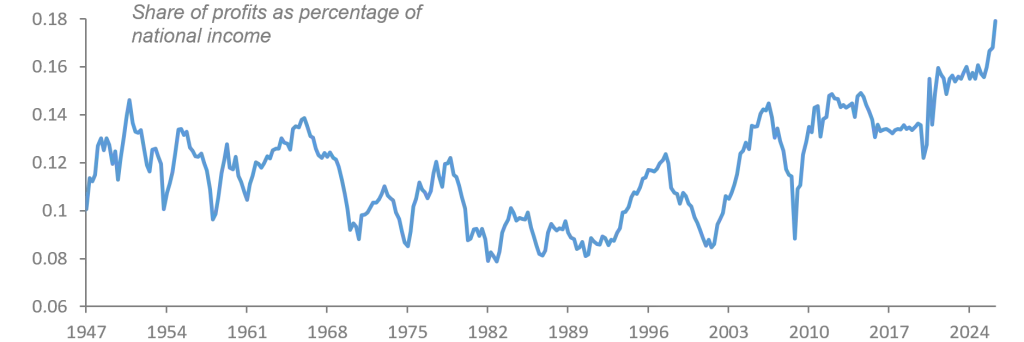
US corporate profits are surging following productivity gains…
Sources: Accuracy, BEA, Macrobond
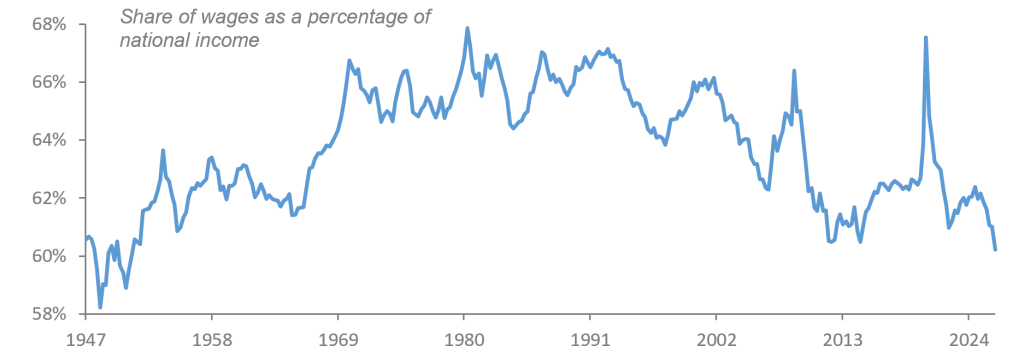
- …but the gains do not appear to be reaching wages.
The distributional picture is far less favourable, however. Real hourly compensation fell by 3.1% quarter on quarter at an annualised rate in the second quarter. At the same time, the share of national income paid to employees in wages and benefits fell back to levels comparable with those of the 1950s…
Capital is moving in the opposite direction. Pre-tax profits reached a record $4.8trn in the second quarter, equal to 18% of national income, their highest share since the post-war period. This reveals a clear contradiction: labour is becoming more productive, yet its real remuneration and share of the value created are falling. The distribution of value added therefore appears to be shifting towards capital. Will it swing back towards labour?
…but this is not reflected in wages
Sources: Accuracy, BEA, Macrobond
Economic policy
As supply constraints return, what becomes of the old policy mix?
In the 2010s, weak demand was the principal macroeconomic concern. High unemployment, interest rates close to zero, below-target inflation and output below potential created an environment in which monetary and fiscal policy could support activity with limited inflationary risk. Do the 2020s therefore mark a change of regime?
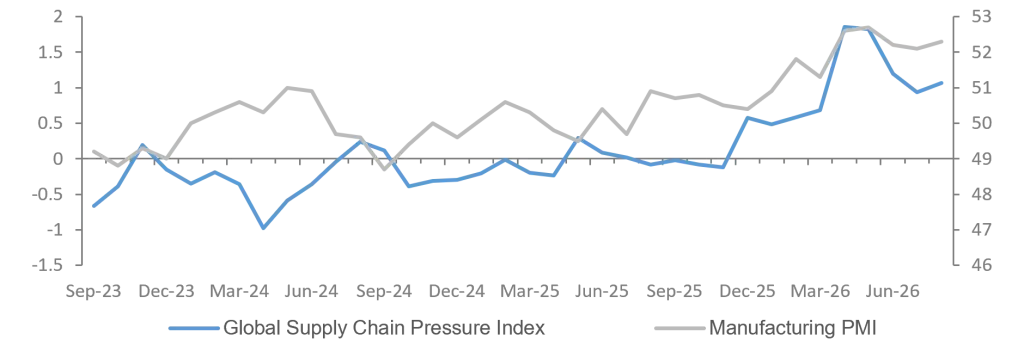
AI-led growth in manufacturing activity is accompanied by rising
supply-chain pressures
Sources: Accuracy, New York Fed, S&P Global, Macrobond
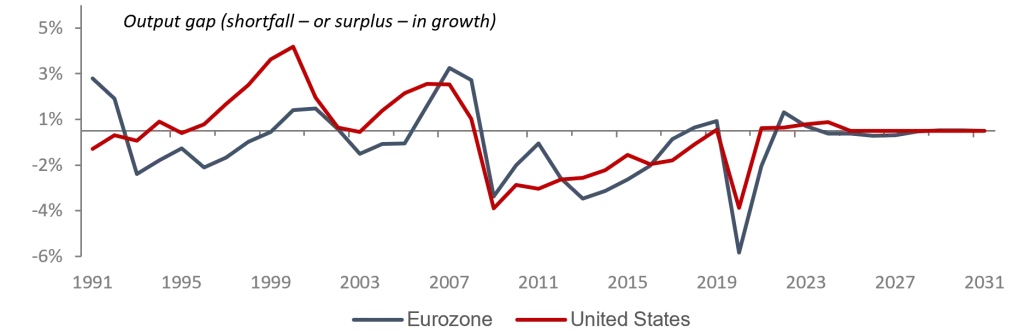
The demand-deficient 2010s have given way to an era of
constrained supply
Sources: Accuracy, IMF, Macrobond
The pandemic, trade fragmentation, armed conflict, energy tensions, demographic ageing and the reshoring of value chains have put productive capacity back at the centre of the diagnosis. These constraints are now compounded by the rise of artificial intelligence, whose vast requirements for investment, electricity, semiconductors and industrial metals intensify resource scarcity. The world may thus have shifted from an era of abundance and excess savings to one of multiple shortages and insufficient savings, structurally more inflationary and associated with higher real interest rates.
Unlike a demand shock, which reduces growth and inflation at the same time, a supply shock slows activity while raising costs, confronting the central bank with a trade-off between output and price stability. It can look through a temporary shock, but repeated pressure on energy, transport, components and raw materials risks spilling into underlying inflation and unanchoring expectations. This new regime also redistributes income: it favours producers of energy and technology, but hits Europe especially hard because of its dependence on imported fossil fuels, semiconductors and metals, even though its underlying inflation and wages remain contained for now.
Indeed, raising interest rates does not solve productive or logistical problems. Instead, it depresses demand in response to supply constraints, hitting housing, industrial investment and the public finances hardest. A broad fiscal stimulus would be equally ill-suited to an economy operating near capacity, as it would fuel inflation and add to debt that becomes more expensive when real interest rates exceed growth. A new division of labour is therefore needed: monetary policy should anchor expectations, while fiscal policy provides targeted support and investment that expands supply.
Trade policy
The highly uncertain economic returns from tariff protectionism.
I. A first wave that raised costs and redirected trade flows
The tariffs imposed in 2018–19 under the first Trump administration compressed import volumes and raised costs, but around 60% of the tariff burden was absorbed through the margins of foreign exporters and domestic resellers. This calls into question the strategy’s ability to benefit US producers.
II. A massive second wave, but with limited macroeconomic effects
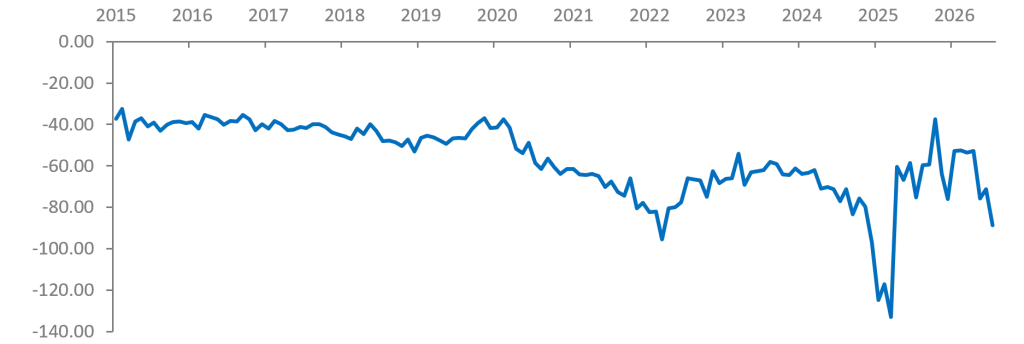
The 2025 ‘Liberation Day’ wave temporarily enlarged and then reduced the goods trade deficit, as importers brought purchases forward before the tariffs took effect. Once adjusted for these fluctuations, the external deficit changed little.
Moreover, the revenue gains announced when the tariffs were introduced do not appear to have materialised in full. Following the US Supreme Court’s ruling that the 2025 customs duties were unlawful, the federal government must refund a substantial share of the levies collected. To date, refunds have reduced the gains from $174bn to $64bn.
Monthly US trade deficit, $bn
Sources: Accuracy, BEA, Macrobond
Tariff refunds wiped out revenue in May, June and July 2026

Sources: Accuracy, US Department of Treasury, Macrobond
III. A visible political and economic cost
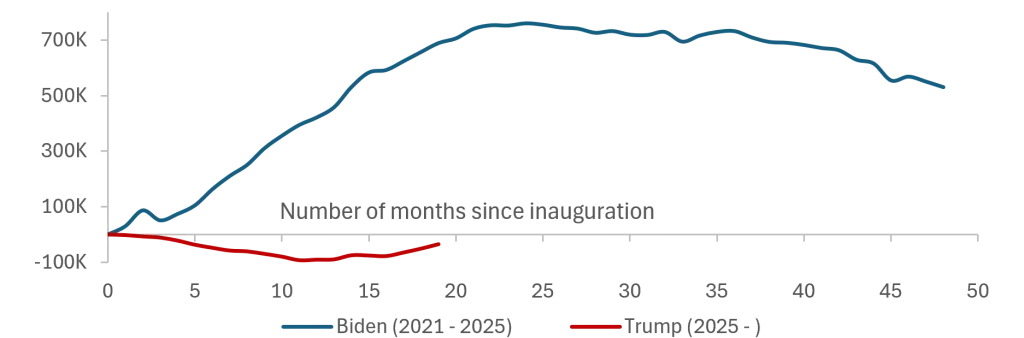
The labour-market record is unfavourable. The United States has lost 75,000 manufacturing jobs since Donald Trump returned to office in January 2025. Spending on factory construction fell by 26.4% from January 2025 to $174.8bn in May, its lowest level since February 2023.
Tariff policy has raised consumer prices by around 0.8%, while nearly half of companies paying customs duties still expect to pass more of the cost on to their customers.
Cumulative change in US manufacturing employment under
Biden and Trump
Sources: Accuracy, U.S. Bureau of Labor Statistics, Macrobond
A change in legal basis, not in economic logic.
After the Supreme Court struck down some tariffs, the administration sought to preserve high import duties by invoking more robust statutes, principally Section 301 of the Trade Act of 1974.
- A new wave targeting 60 trading partners
The United States now imposes duties of between 10% and 12.5% on imports from most of its major trading partners. The United Kingdom, Canada, Mexico, India, Malaysia and the European Union are among those subject to a 10% rate, while Japan, South Korea, Australia, Switzerland, China and Singapore fall into the 12.5% bracket.
- Exemptions and trade-offs
The new duties include exemptions for products such as oil, gas and fertilisers, certain goods already covered by sectoral tariffs, and products falling under the North American trade agreement with Canada and Mexico. The aim is also to safeguard products that the United States does not produce, or whose inclusion could trigger deeper economic disruption.
- More durable tariffs?
The Office of the United States Trade Representative (USTR) accuses the targeted economies of failing to prevent goods made with forced labour from entering their supply chains. Section 301 can be used against foreign practices deemed unreasonable or discriminatory. Its process is longer, but also harder to challenge.
- …or doomed to fail?
“Times change, the Constitution does not.”
John Roberts Jr, Chief Justice of the United States.
Ultimately, whatever statutory authority is invoked (the Trade Act of 1974 or another law), the Supreme Court makes no exception: the power to impose customs duties belongs to Congress alone, not to an overreaching presidency. This new wave will almost certainly prove temporary once again.
- What next? The risk of tariff layering
On the one hand, the global economy appears to have become accustomed to US tariffs and their volatility. On the other, the stated justification seems somewhat hypocritical given that the United States itself has not ratified the International Labour Organisation’s Forced Labour Convention. Finally, the USTR plans to impose duties linked to overcapacity – production beyond what can be consumed or invested productively at home – on 16 of the United States’ main trading partners before year-end.
Falling direct flows mask a reshaping of trade routes and production stages
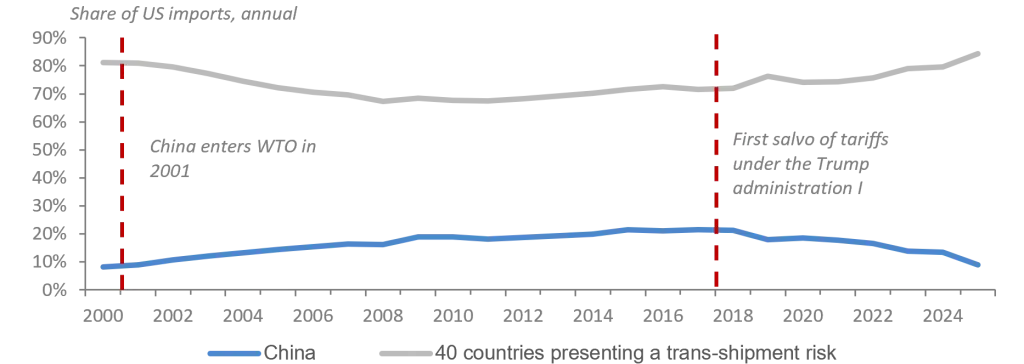
China’s declining share of direct US imports masks a new reality in trade between Beijing and Washington: some goods originating in China now pass through intermediary countries and are embedded in value added through the equipment and services used.
The first Trump administration’s 2018 tariff salvo produced two effects simultaneously. It encouraged genuine production diversification in some countries and moved certain capacities closer to the US market. But it also increased the profitability of rerouting goods or changing their declared origin without meaningful economic transformation (trans-shipment).
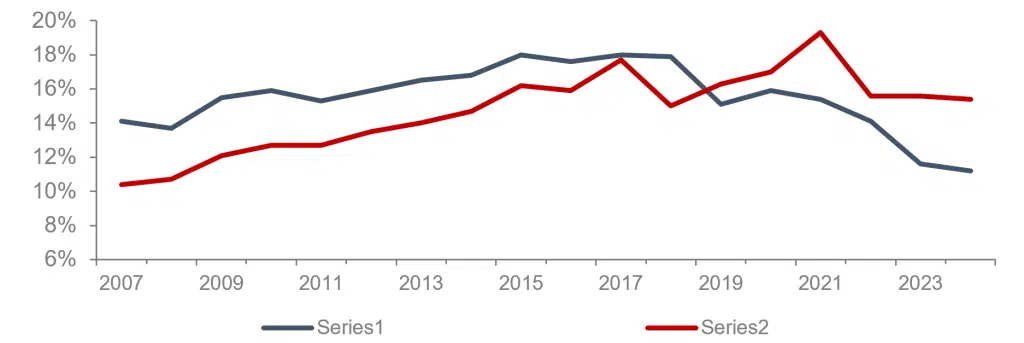
Successive tariffs on China failed to reduce dependence on
Chinese supply
Sources: Accuracy, U.S. Census Bureau
⇒ A non-linear incentive to reorganise trade flows
When the tariff differential between two countries is small, companies have little incentive to bear the fixed costs of changing their production chain. Direct trade therefore continues to dominate.
At an intermediate level, the tariff gap can encourage legitimate production reallocation (for example, investment in a new plant, supplier diversification or the relocation of assembly stages) and create new industrial capacity in third countries.
When the tariff differential becomes very large, the gain from changing a product’s origin rises sharply. Incentives for trans-shipment through minimal assembly, repackaging or document falsification increase accordingly.
The substantial reallocation of imports following the 2018 tariffs
(Trump I)
Sources: Accuracy, U.S. Census Bureau
⇨ Significant flows that remain poorly measured
Estimates of annual US customs-revenue losses range from $40bn to $303bn, depending on the methodology and how fraud is defined. The consensus estimate is nevertheless around $70bn a year. For a tariff gap of 25–45% between two countries, one of them China, this would represent $19bn–34bn in uncollected duties. The effect on GDP remains ambiguous, since lower customs duties also mean cheaper imports and inputs.
The risk of trans-shipment
1. Large, diversified platforms
⇨ Trans-shipment risk concealed within large volumes of legitimate trade.
These are intermediary countries to which a significant share of production has genuinely moved. Links with China remain important through the use of imported inputs, but local factors of production are employed and some transformation takes place locally.
Countries concerned: Canada, the European Union, India, Israel, Japan, Mexico, South Korea and Taiwan.
On cross-border freight, Mexico and Canada attract closer scrutiny from US customs because trade agreements among the three countries can reduce tariffs to zero, including for trans-shipped goods.
2. Production hubs closely integrated with China
⇨ Significant volumes and greater dependence on Chinese supply chains, inputs, production and logistics.
These countries combine genuine local capacity and assembly with Chinese sourcing. They occupy the grey area between real production diversification and transformation too limited to justify assigning a new origin to the product.
Countries concerned: Brazil, Indonesia, Malaysia, Thailand, Turkey and Vietnam.
3. Small opportunistic platforms
⇨ Low volumes, but a specific advantage.
Free zones, ports, bonded warehouses, preferential access to the US market, niche assembly, limited oversight and cheap labour all give some small economies a disproportionate role in rerouting trade. This is the most concentrated risk and potentially the easiest to target.
Countries concerned: Argentina, Azerbaijan, Bangladesh, Cambodia, Chile, Colombia, Costa Rica, the Dominican Republic, Georgia, Jordan, Kazakhstan, Kenya, Laos, Morocco, Myanmar, Oman, Panama, Peru, the Philippines, Singapore, Sri Lanka, Switzerland, the UAE and Uzbekistan.
4. Is more targeted enforcement possible?
⇨ More complex routes, but also more usable evidence.
The multiplication of intermediaries makes it harder to establish a product’s legal origin. But it also generates anomalies: transit times incompatible with genuine transformation, re-exports closely matching imports, volumes unrelated to local absorption capacity, and ownership links among producers, intermediaries and importers.
In this context, Peter Navarro’s Office of Trade and Manufacturing Policy (OTMP) proposes an AI-based screening system in its latest report, dubbed ‘Border Detective’. It would compare declared origins, shipping histories and product data with reference models on a large scale. The aim is to turn AI-generated anomaly alerts into concrete sanctions (for example, the collection of customs duties and exclusion measures).
Public debt
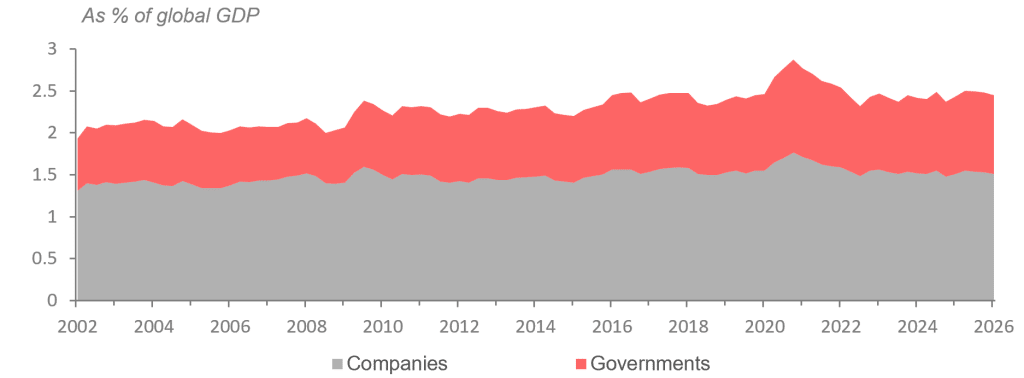
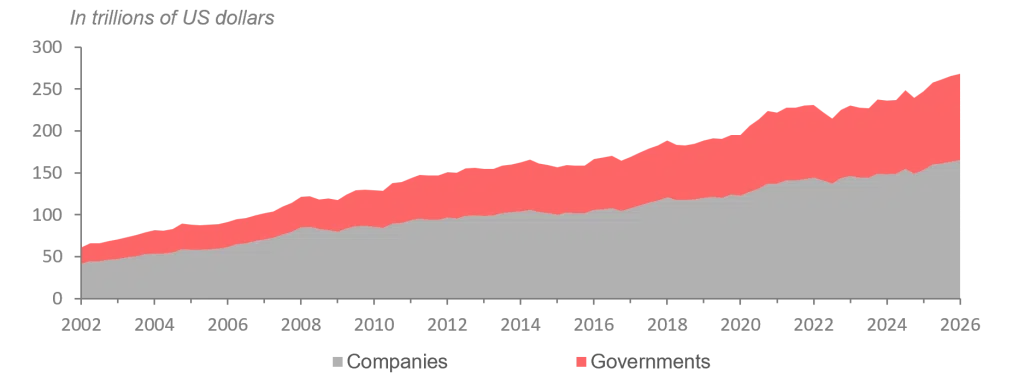
Are you more focused on volume or price?
Global debt by sector
Sources: Accuracy, IMF, Macrobond
Global debt by sector
Sources: Accuracy, IMF, Macrobond
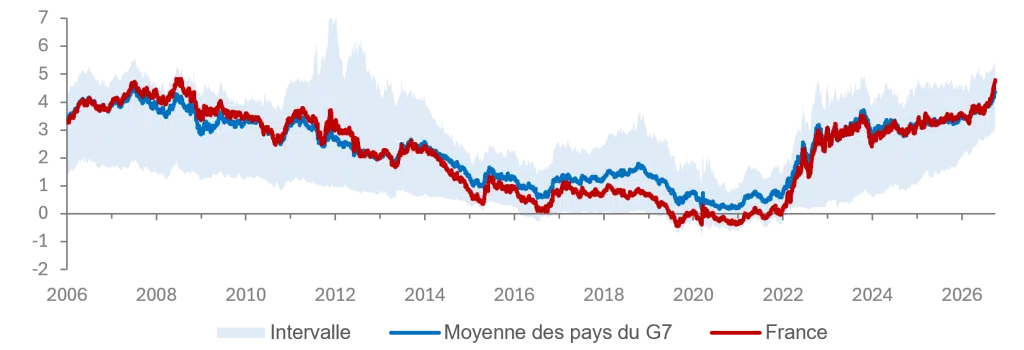
The average cost of debt across G7 countries now exceeds its
2008 level
Sources: Accuracy, Macrobond
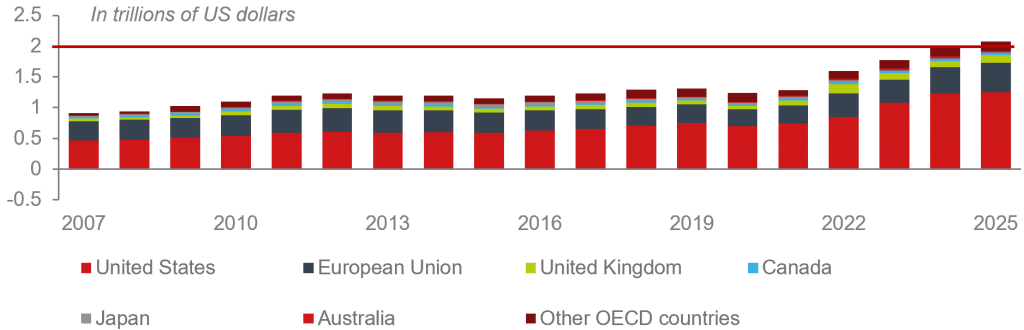
General government net interest expenditure exceeds $2trn a year
Sources: Accuracy, OCDE, Macrobond
Government bond markets
Vigilance is required
10-year yields are climbing
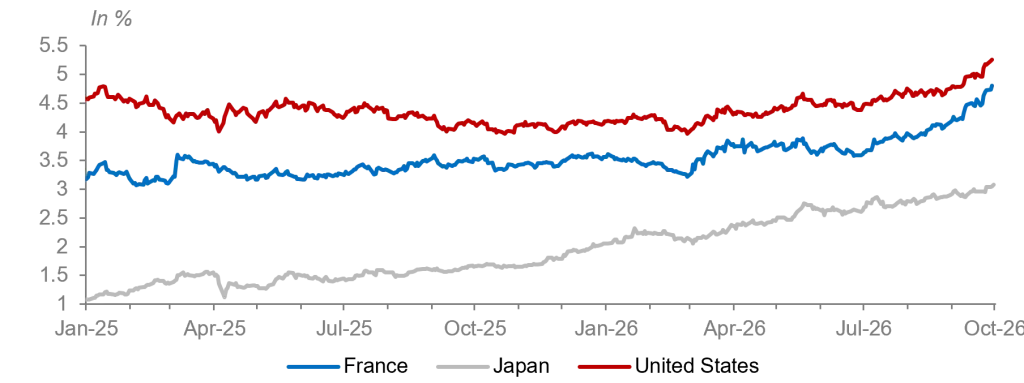
Sources: Accuracy, Macrobond
Breakdown of 10-year government bond yields: concern over
economic policy and optimism about growth
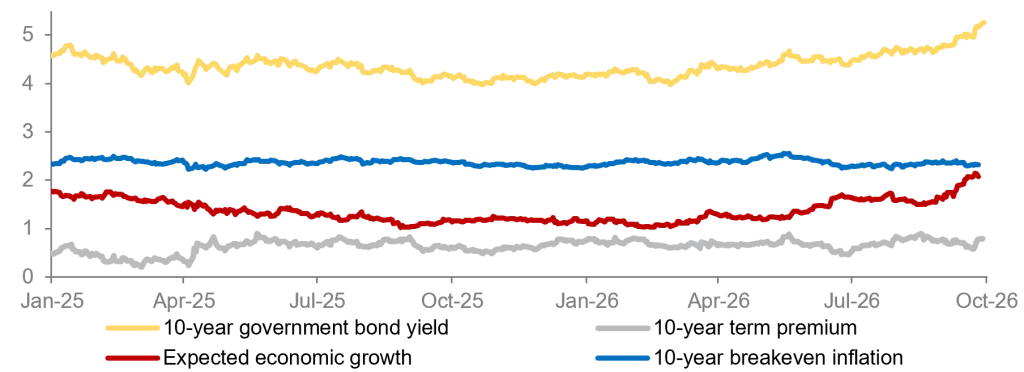
Sources: Accuracy, Macrobond
10-year minus 2-year government bond yield spread: curve
steepening
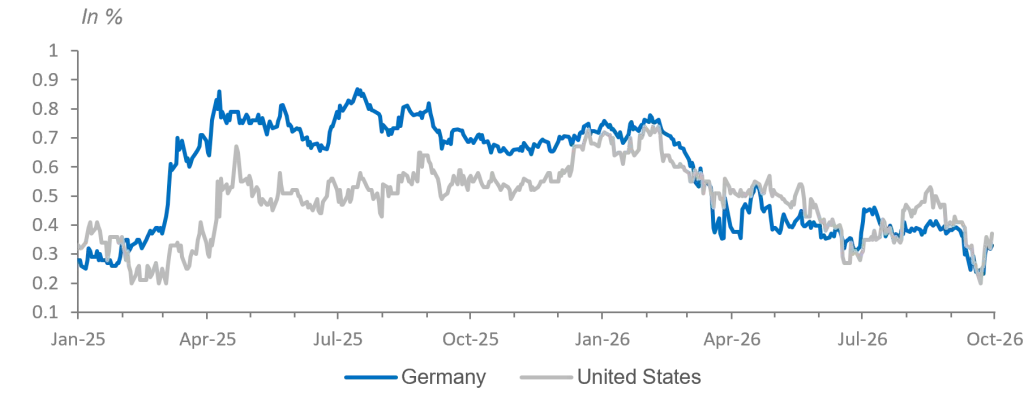
Sources: Accuracy, Macrobond
Yield spreads versus Germany: France’s weak position
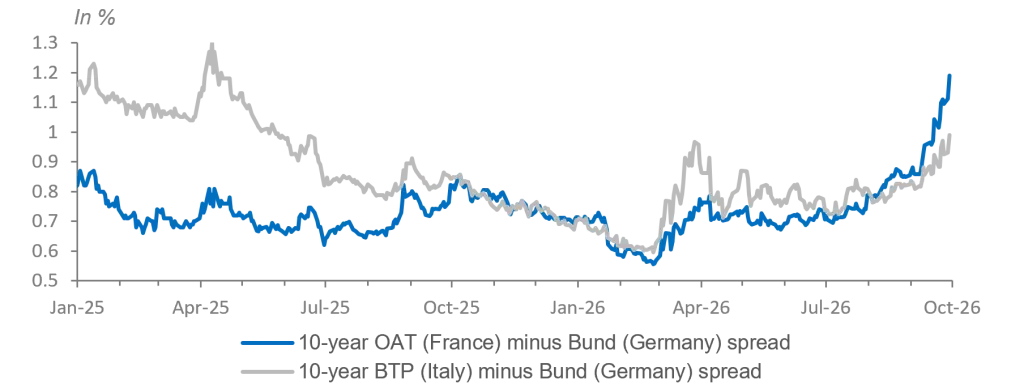
Sources: Accuracy, Macrobond
Markets: long-term rates and equities
Is the relationship changing?
Equity markets supported by a strong profit outlook
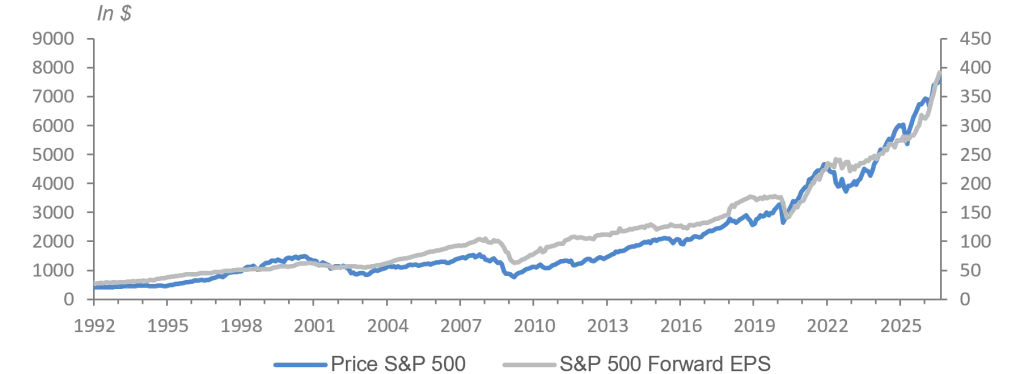
Sources: Accuracy, S&P Global, Macrobond
Equity markets held back by falling valuation multiples
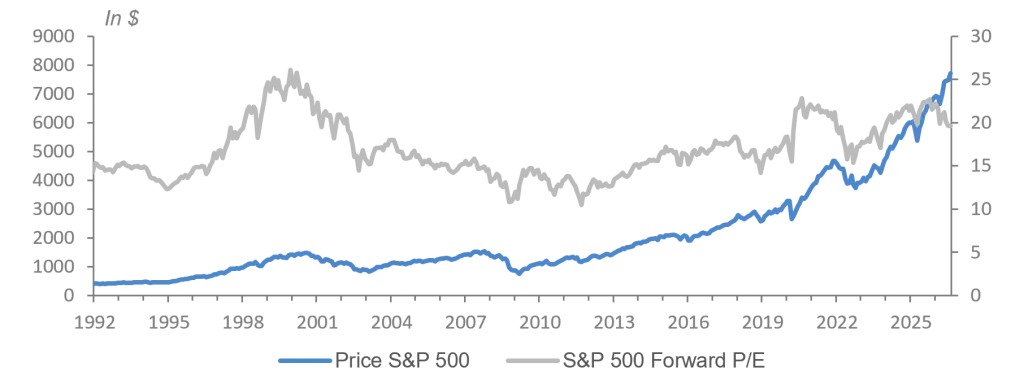
Sources: Accuracy, S&P Global, Macrobond
Rising long-term yields are reducing valuation multiples
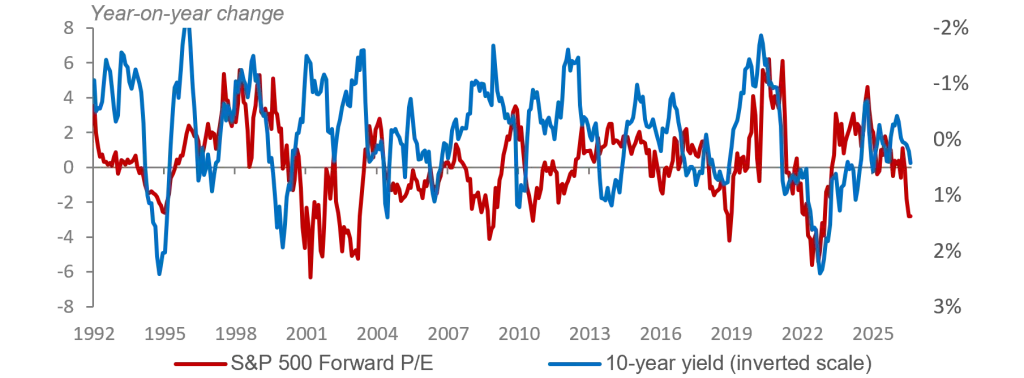
Sources: Accuracy, S&P Global, Macrobond
Correlation between equity prices and 10-year bond yields
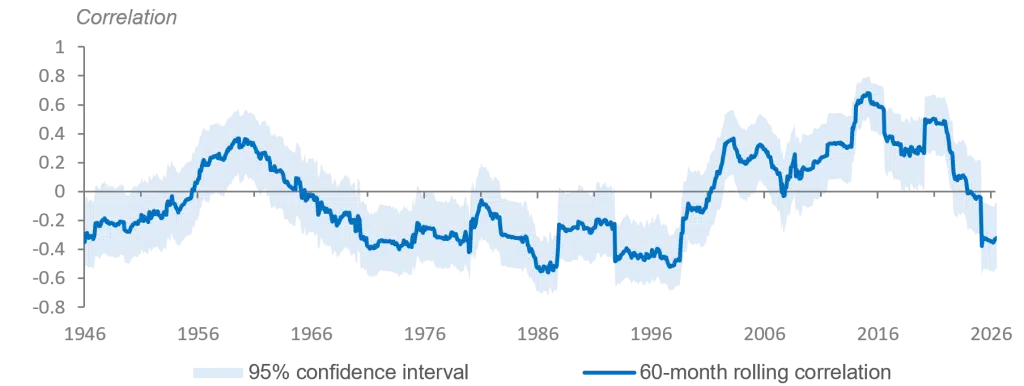
Sources: Accuracy, Macrobond
Snapshot: the pre-war economy
How can one fail to see that the international environment is deteriorating and becoming more uncertain? Without shifting into a fully fledged war economy, France and Europe more broadly are now moving towards an economy geared to preparing for war. This means a gradual increase in military effort, but also profound changes in how the economy operates, across demand, supply and financing. In this context, the issue is not simply how much must be mobilised, but also which macroeconomic balances must be preserved and which political choices must be sustained over time.
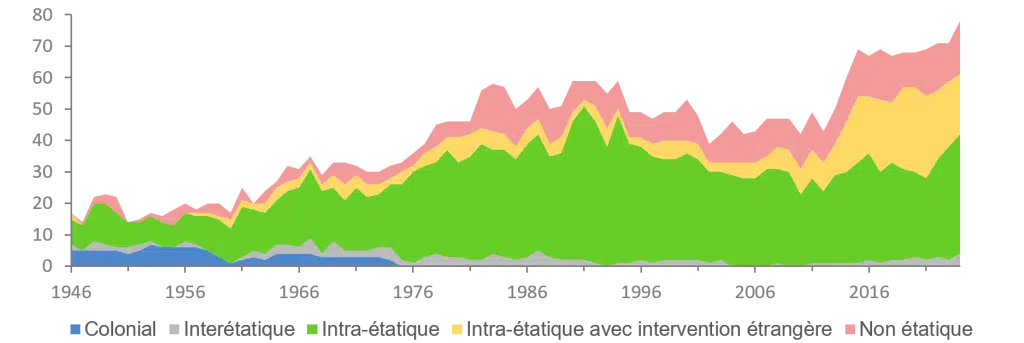
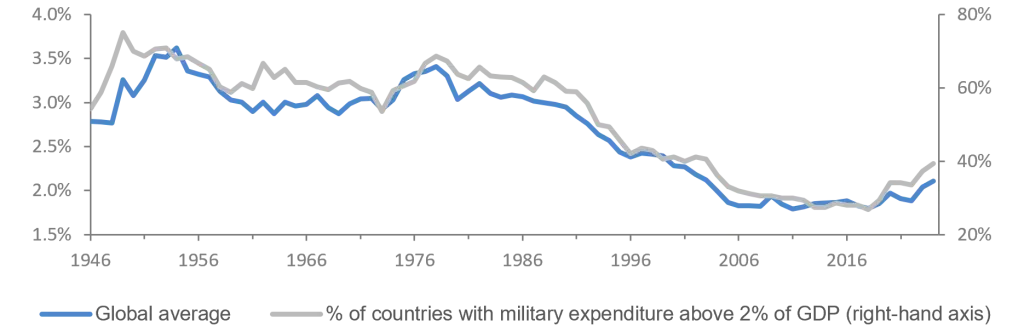
How can one deny that the world is becoming more dangerous? Russia’s war in Ukraine has lasted for more than four and a half years. It has now run far longer than the First World War, which lasted 1,566 days. The war launched this year by the United States and Israel against Iran began in late February and is not over, despite several periods of truce. It has spread across the Arabian Gulf and, at times, beyond it. The Strait of Hormuz remains largely closed, while Bab el-Mandeb, at the entrance to the Red Sea, is now controlled by the Houthi rebels, who are linked to the regime in Tehran. This has understandably raised fears of an uncontrolled surge in crude-oil prices, though none has occurred so far. In neither conflict does a lasting peace appear to be in sight. The parties that believe the military balance lies clearly in their favour (Russia, and the United States together with its Israeli ally) are seeking the enemy’s unconditional surrender. Neither Ukraine nor Iran is prepared to accept. In their eyes, at least, the balance on the ground is not so lopsided as to justify capitulation. A broader historical view yields two conclusions. First, the number of armed conflicts is on a clear upward trend. The fact that wars between states still account for a very small, albeit rising, share of the total tempers that conclusion somewhat. Second, in response to this worsening security environment, military spending is increasing: 40% of countries now devote at least 2% of GDP to defence. The rise is unlikely to stop soon. NATO’s target for member states is 3.5% from 2035.
Armed conflicts since the Second World War: the trend is
clearly rising
Sources: Accuracy, IMF
Military expenditure is rising around the world
Sources: Accuracy, IMF
Against this backdrop, the phrase ‘war economy’ is now widely used. But is it appropriate and what does it actually mean? Take France, a country with a long history of warfare, recent decades aside. Some perspective is needed. During the First World War, when the entire economy was organised and managed with victory in mind, military spending rose from an estimated 4–5% of GDP just before hostilities began to 40–50% at the conflict’s most intense moments. In the decade before the Second World War, the effort mounted crescendo as international tensions rose: from 2–3% of GDP to 5–8% in 1938–39, again on an estimated basis. Skipping over the 1940s, three further observations stand out: defence spending was 6–7% of GDP during the wars of decolonisation, around 4% during the cold war and just under 2% in the era of the ‘peace dividend’. The target is now 3.5%, or even 5% for security spending as a whole. Clearly, the word ‘war’ covers an extraordinarily wide range of military budgets: from 4% to 50% of GDP. The concept of a war economy therefore needs sharpening. To be sure, the term belongs partly to the language of political communication. As international tensions rise, defence efforts must increase. That is how Emmanuel Macron’s choice of words in June 2022, a few months after Russia invaded Ukraine, should be understood. After three decades of peace dividends, France, Europe and perhaps the world are entering a new era. The task is therefore to define the action this era requires.
For that purpose, let us draw on the approach proposed by Maxime Cordet, research director at the French Institute for International and Strategic Affairs (What Does “Wartime Economy” Stand For?, October 2025), though we will not follow it in every respect. We should begin by distinguishing between peacetime and wartime economies, defining the former as one that requires a military effort intended to prevent war. That effort is calibrated to the perceived level of threat, which is assumed to be relatively low and stable. The long era of the peace dividend is a good example. A war economy, by contrast, has two dimensions, plus an optional third:
- an economy preparing for war, in response to mounting threats;
- an economy at war, whose purpose is to wage and win it;
- the optional role of supporting an ally in a conflict in which the country itself is not a belligerent.
It is difficult not to acknowledge that, hic et nunc, Europe, including France, is veering towards an economy geared to preparing for war, while also providing sustained support to its Ukrainian ally? But how does such an economy work?
Let us begin with the hardest issue: reconciling different time horizons. Rising tensions demand an immediate response: ensuring that the existing military model is fully operational, with serviceable equipment, replenished stocks of consumables such as ammunition, and personnel who are both fully staffed and properly trained. It is also essential to anticipate the nature of tomorrow’s armed conflicts. That outlook shapes decisions on force structure, the design and procurement of new equipment, personnel training and even the alliances to be formed and the degree of co-operation within them. The ability to bridge the short and medium term is central to the response, whether on demand, supply or financing.
On the demand side, the state is the customer. Once that obvious point is made, two questions arise. First, is the transaction between a government and a domestic manufacturer, or does it involve a foreign supplier? The case of a domestic company selling abroad must also be considered. Second, on what terms are orders placed: partnership, development and/or production, volume, the split between firm and optional commitments, price and payment conditions? For many countries, finding the right answer is far from straightforward. Public finances are often already strained; favouring domestic suppliers is not always feasible, especially when time is short and the geopolitical environment is seen as dangerous; and the visibility suppliers need (to ensure delivery and the proper conclusion of the contract) runs up against both constraints.
The supply side may be more complicated still. Capacity had fallen especially low during the ‘happy years’ of the peace dividend. Investment must now be stepped up in both R&D and production – and as quickly as possible. This applies both to rebuilding inventories and to developing and manufacturing the next generation of weapons. Unfortunately, the process runs into four obstacles: supply chains weakened by geopolitical and geoeconomic tensions; a regulatory and standards framework that creates complexity and often slows projects below the desired pace; a workforce with the right skills, which is as essential as it is scarce; and, as on the demand side, the difficulty of giving firms throughout the sector sufficient visibility and confidence that financing will follow, without pushing the associated risks to unreasonable levels.
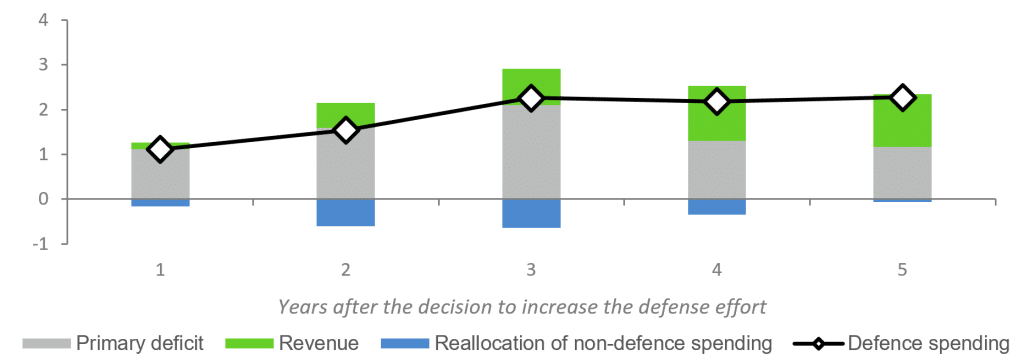
Then there is financing, a question with several dimensions. First, we must ask whether the solutions used in the past can be repeated: allow public deficits to rise, then gradually make trade-offs through higher taxes and/or a shift in the balance between civilian and military spending in favour of the latter. This time, what was once supplementary may become central. That will inevitably raise questions of political and social acceptability, as well as economic competitiveness.
Average breakdown of funding for the increases in military spending
(cumulative change in percentage points of GDP)
Sources: Accuracy, IMF
Second, savings and credit flows will need to be channelled towards financing the military effort. The aim is to make it easier to fund defence companies and the state in its role as customer. Savings products could be created to steer private money into suitable bonds or even equities. Banks could likewise be encouraged to direct more credit towards the defence industry. In both cases, tax and/or regulatory levers would be required. This may be harder than it sounds. Sources of finance are already under considerable pressure. Alongside strengthening national security, governments must deliver the energy transition, accelerate the digital transformation of their economies, including the rollout of AI, and safeguard financial stability so as not to jeopardise the Treasury’s access to refinancing on reasonable terms. In a less open international environment, and amid doubts over the future scale of cross-border capital flows, the position could become more difficult for countries already living beyond their means. What if the balance of payments became a concern once again?
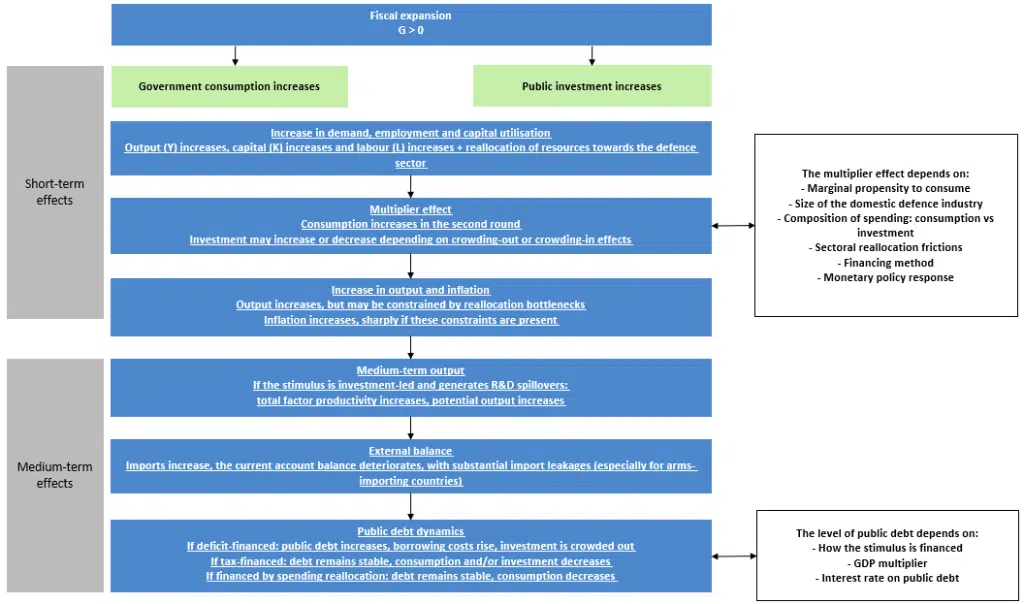
What, then, are the macroeconomic consequences? We conclude with two perspectives. The first view is more analytical and comes from the IMF (World Economic Outlook, April 2026). It examines the post-war period, uses a sample containing more emerging and developing economies than advanced ones, and focuses on rearmament drives lasting more than two and a half years. Ultimately, growth picks up slightly; inflation rises modestly but temporarily; monetary policy tightens; and the current-account balance deteriorates. Public debt increases at first, then stabilises as fiscal policy becomes better balanced. The second approach draws on the experience of the 1930s before the Second World War with a focus on Germany, France, the United Kingdom and the Soviet Union. Against a backdrop of determined public policy, albeit to varying degrees (industrial policy and even planning, the loosening of fiscal constraints where possible, efforts to prevent runaway prices and close attention to the external accounts), growth accelerated and labour markets moved towards full employment. The differences between these experiences matter, since the objective was readiness for war. France and Britain were too cautious and acted too late. Germany and the Soviet Union were more effective and therefore better prepared.
A note of caution: these two perspectives do not converge. An economy preparing for war is not the same as a pre-war economy. Looking back ex post introduces an analytical bias. Economic performance must also be judged against the political framework in place. Does it support a market economy, or does it override one in the name of higher interests? The outcomes cannot be the same in every case.
Military spending: transmission channels
Sources: Accuracy, IMF
Hervé Goulletquer, Senior Economic Adviser, Accuracy
Do not be lulled by the appearance of a resilient economy