OUTLOOK: how to hold course when navigating by sight?
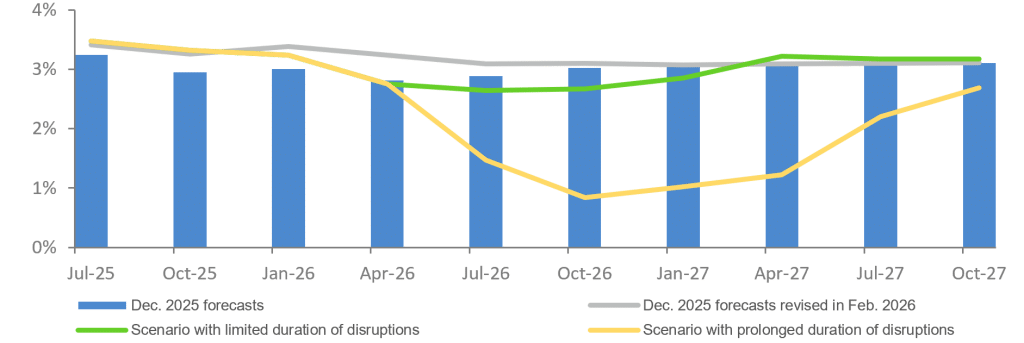
In an environment where reference points are blurred, holding course first requires that uncertainty be properly characterised. The conflict in the Middle East illustrates how quickly geopolitics can reshape equilibria – without producing a clear winner, but with lasting effects on confidence, energy markets and trade. At the same time, global activity remains fragile. Europe is struggling to regain momentum, and sectoral signals remain mixed. Inflation, far from having disappeared, still requires a high degree of vigilance from central banks, which are forced to arbitrate between supporting growth and maintaining anti-inflation credibility. OECD scenarios highlight the possible divergence between a temporary shock and a more prolonged disruption. Added to this are the Chinese shock, the resurgence of industrial policies and demographic challenges. Navigating by sight therefore does not mean abandoning direction: it means accepting imperfect maps, multiplying scenarios, and preserving the capacity to adapt.
Middle East conflict: is there a winner?
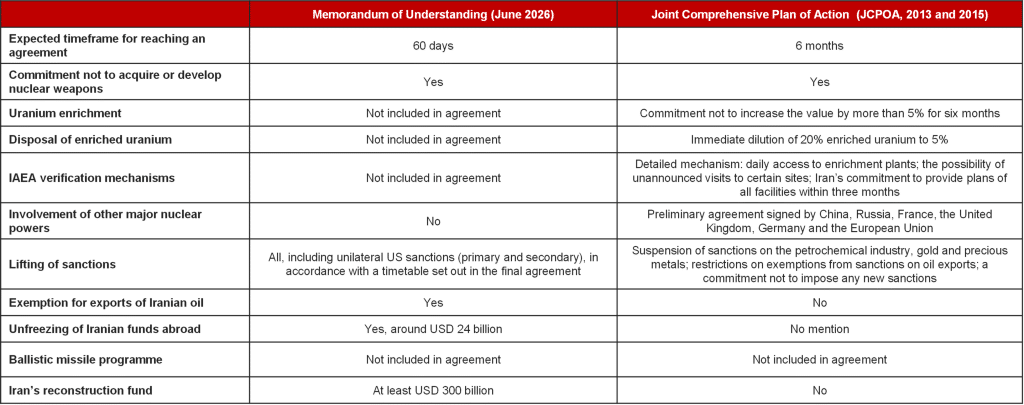
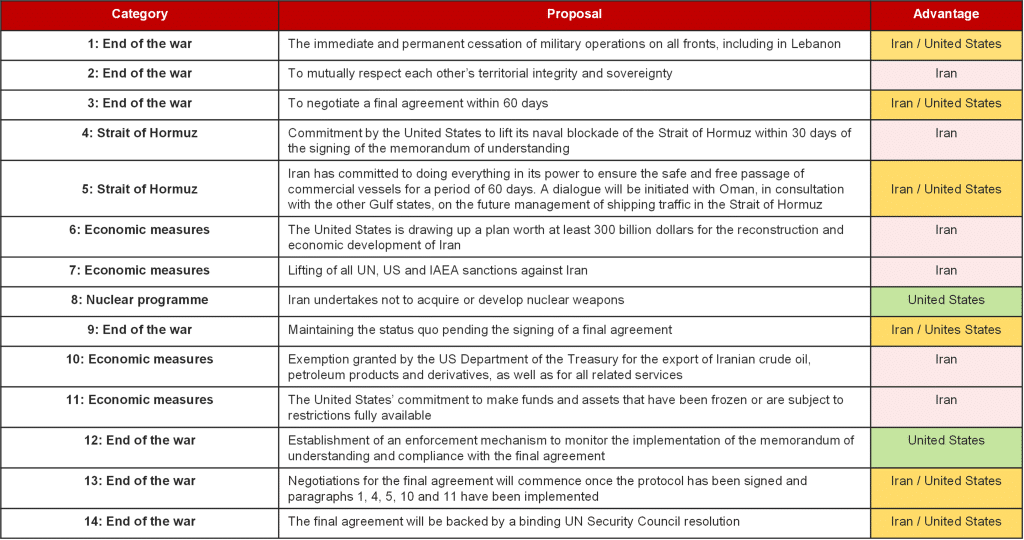
1 – The 14 commitments from the US–Iran agreement signed on 17 June: advantage Iran
2 – From one agreement to another: a less restrictive framework for Iran, albeit following a war marked by extensive destruction
- The United States has only very partially achieved its objectives.
- Regional allies have grounds to question the reliability of US support.
- Iran is weakened, yet the regime remains in place (albeit likely transformed).
- Elsewhere in the world: Europe is absent, while China and Russia can be satisfied with not having lost an ally.
- Overall: “in the land of the blind, the one-eyed man is king”. The geopolitical environment surrounding the economy remains both uncertain and in flux.
- A question, perhaps somewhat extreme, yet one that is likely to be raised: could this represent a ‘Suez moment’ for the United States?
European sectoral activity
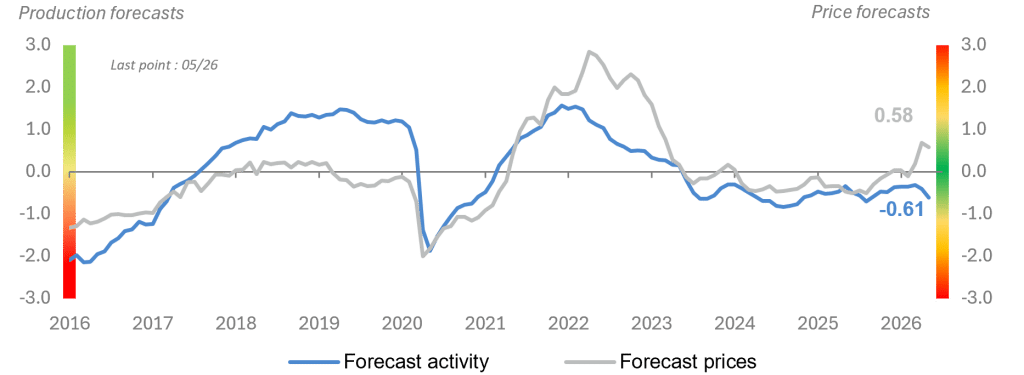
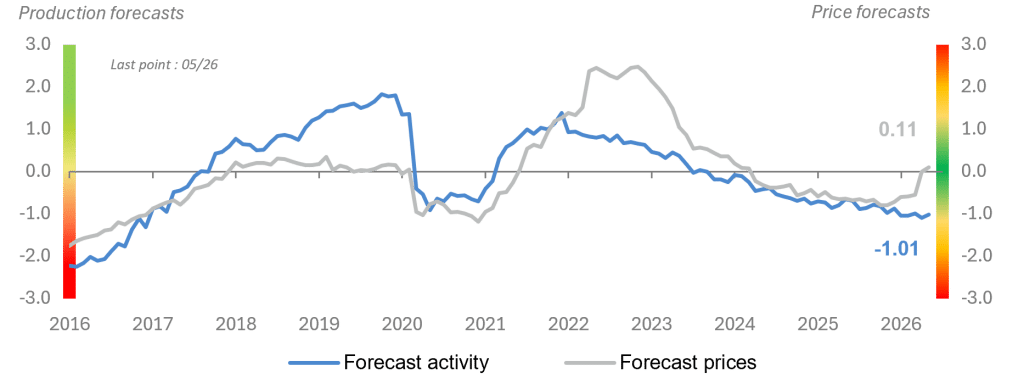
1 – European Union: persistent weakness on the activity side
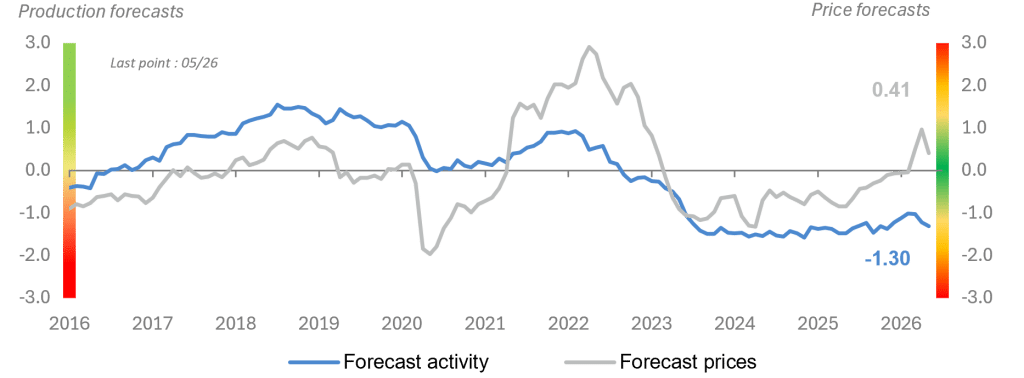
European Union – Industry: future trends
Sources : Accuracy, European Commission
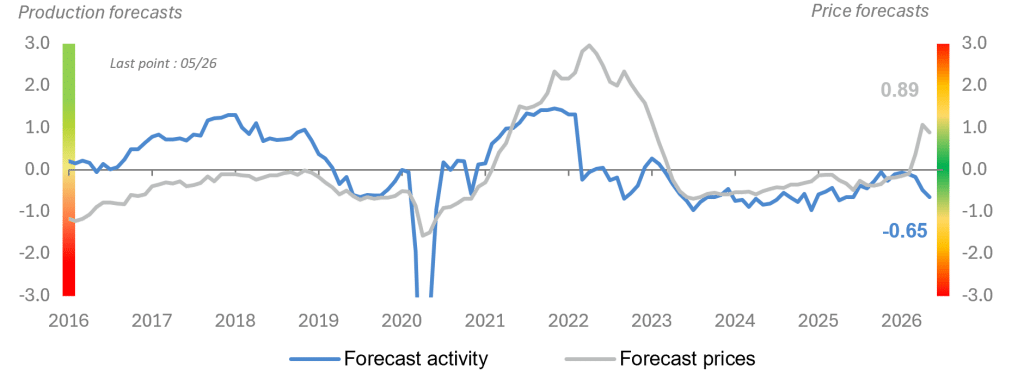
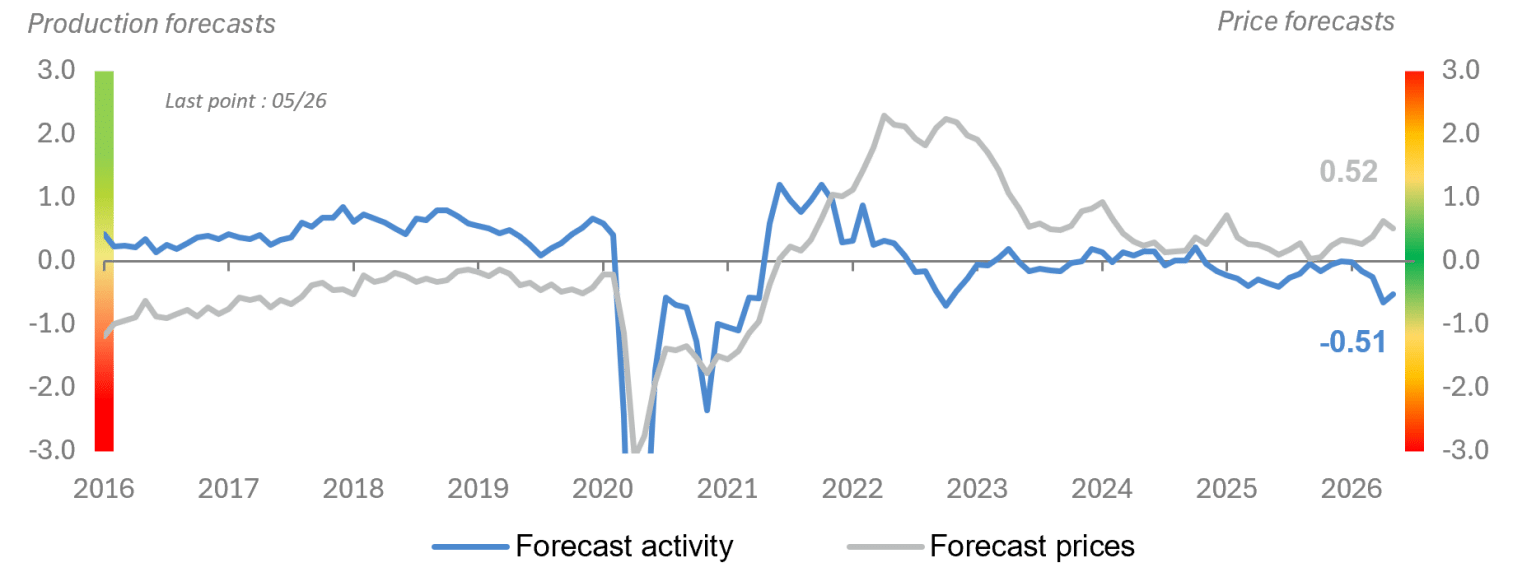
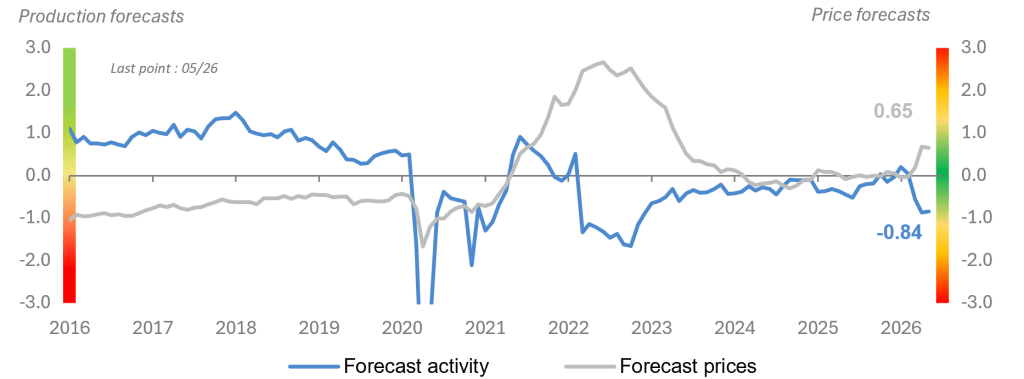
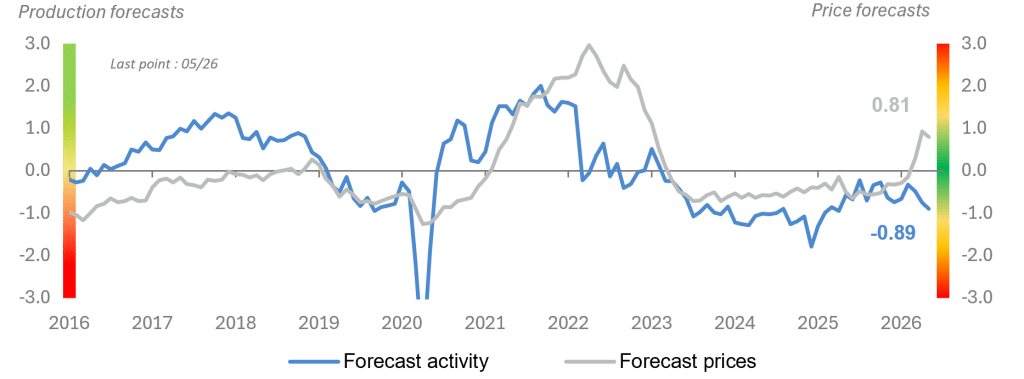
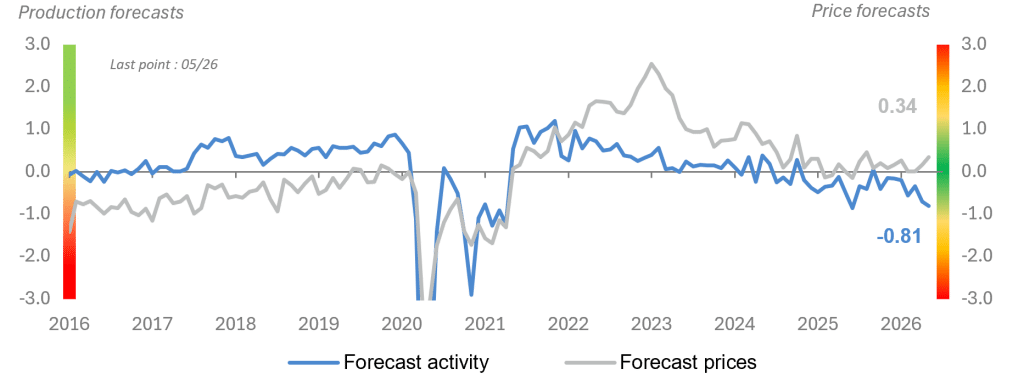
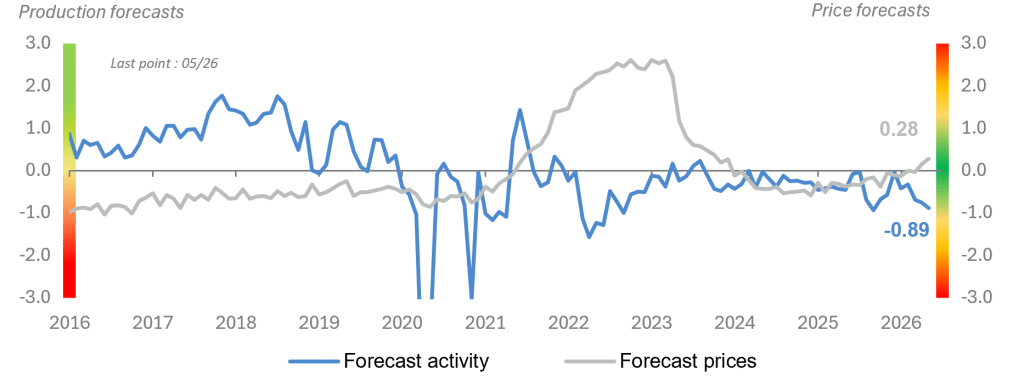
Z-score: measures how far a value deviates from the mean, in standard deviations. The further the z-score is from 0, the further the value deviates from the historical mean (positively when the z-score is > 0, or negatively when the z-score is > 0).
Left-hand scale: the more positive the z-score, the more the trend exceeds the historical mean. The more negative the z-score, the more the trend falls below the historical average.
Right-hand scale: same principle as the left-hand scale, but excessive price rises and falls are both treated as negative, resulting in an increasingly red colour as the data moves further from 0.
European Union – Services: future trends
Sources : Accuracy, European Commission
European Union – Trade: future trends
Sources : Accuracy, European Commission
European Union – Construction: future trends
Sources : Accuracy, European Commission
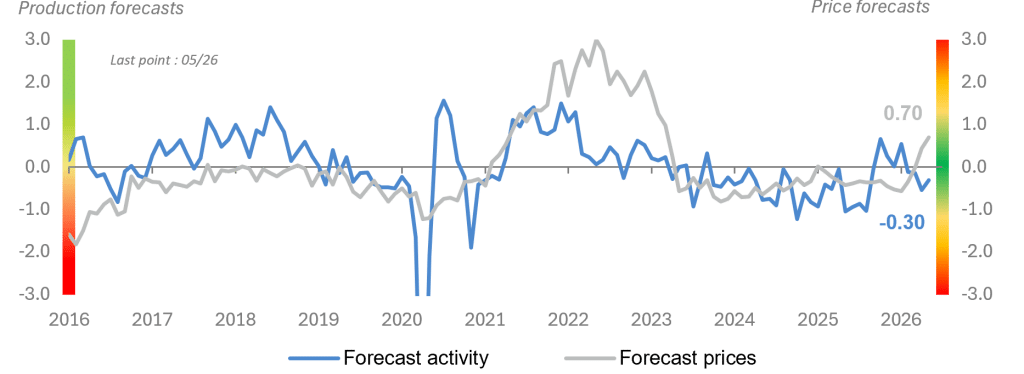
2 – France: industry in a less unfavourable situation?
France – Industry : future trends
Sources : Accuracy, European Commission
France – Services: future trends
Sources : Accuracy, European Commission
France – Trade: future trends
Sources : Accuracy, European Commission
France – Construction: future trends
Sources : Accuracy, European Commission
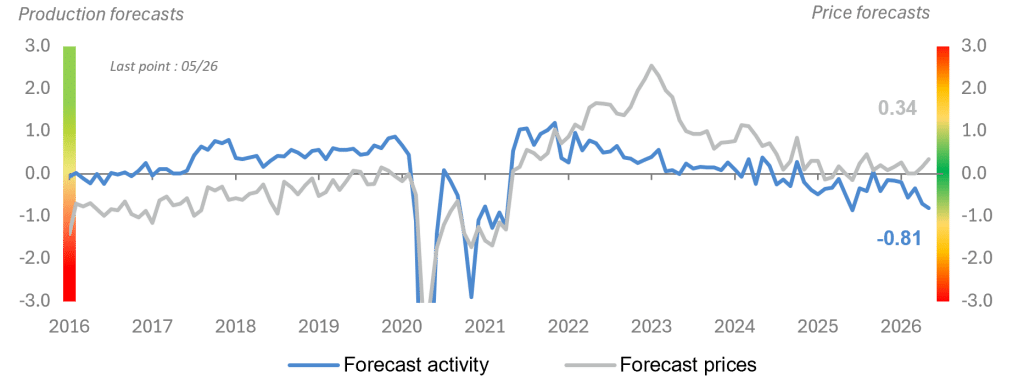
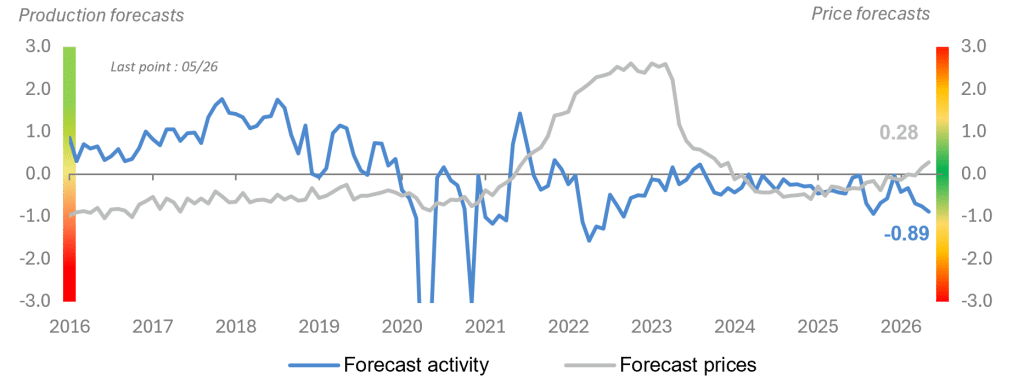
3 – Germany: trade and construction sputtering
Germany – Industry: future trends
Sources : Accuracy, European Commission
Germany – Services: future trends
Sources : Accuracy, European Commission
Germany – Trade: future trends
Sources : Accuracy, European Commission
Germany – Construction: future trends
Sources : Accuracy, European Commission
Initial indications on the activity profile in June
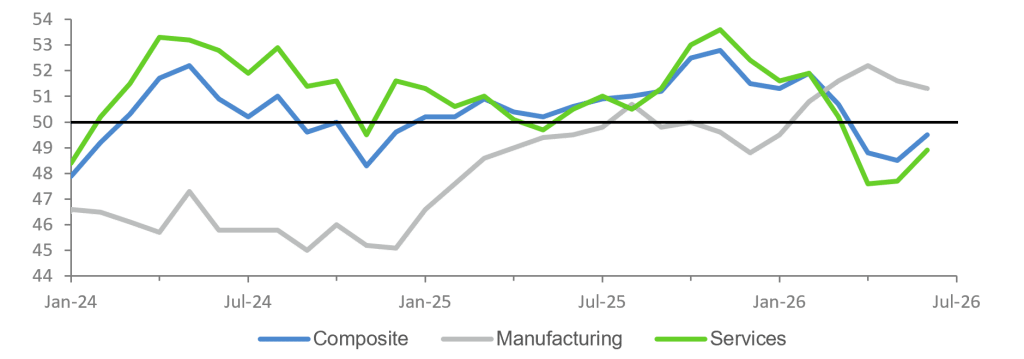
Eurozone PMI points to a slight improvement, due above all to a slowdown in the contraction of services. This suggests that the economy is still proving resilient and may (just about) avoid recession.
The manufacturing sector remains broadly stable: it is slowing somewhat, yet remains in expansion territory, still supported by precautionary stockbuilding.
A stabilisation of GDP in the second quarter may therefore be envisaged, alongside early signs of moderation in inflation. Indeed, the decline in energy prices is already beginning to be felt on the corporate side.
PMI Eurozone: easing of tensions and renewed optimism
Sources : Accuracy, S&P Global, Macrobond
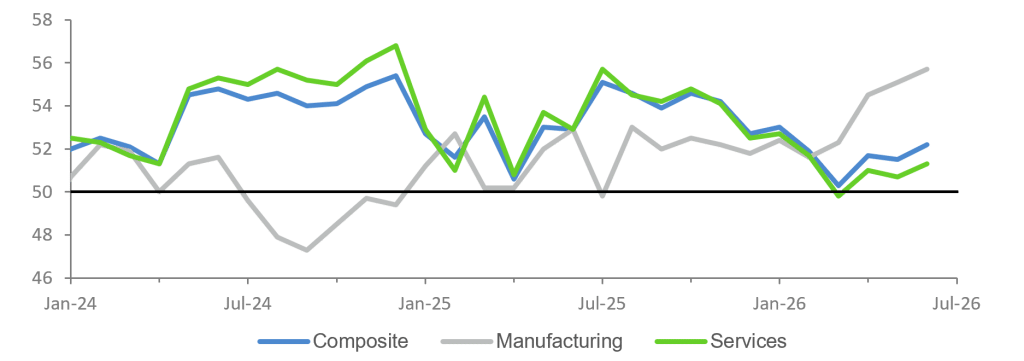
In the United States, activity indicators have improved again for the third consecutive month, supported by a degree of optimism regarding the situation in the Middle East.
However, concerns regarding the economic outlook persist, leading firms to reduce headcount in response to rising costs. Input price inflation has slowed, but remains at a historically elevated level.
Finally, the pace of economic growth remains relatively subdued compared with that observed at the start of 2026, prior to the conflict. A certain imbalance is also apparent within the economy, with weak demand in services contrasting with strong demand for manufactured goods, the latter still supported by stockbuilding against potential supply chain disruptions.
PMI United-States: still taking an optimistic view, but vigilance required for theunderlying messages
Sources : Accuracy, S&P Global, Macrobond
Inflation
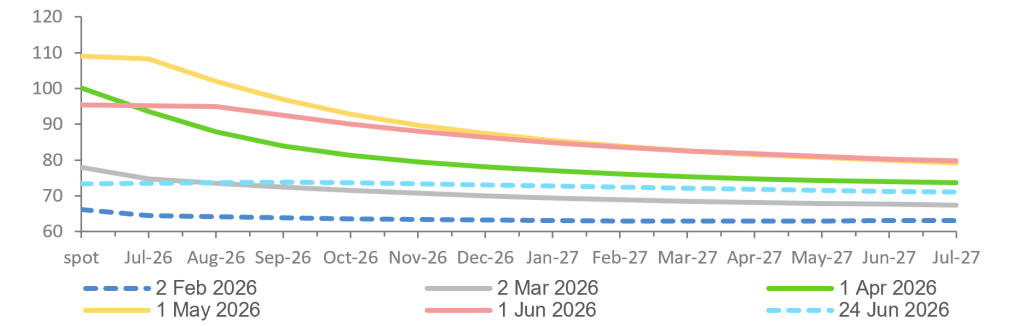
1 – Oil prices are easing, but futures do not indicate a return to the status quo ante
Brent – spot and one-year futures prices: flattening curves, but the market is not convinced that conditions will return to normal
Sources : Accuracy, ICE, Macrobond
2 – Prices in the Eurozone: a loss of momentum from upstream to downstream, yet vigilance remains necessary
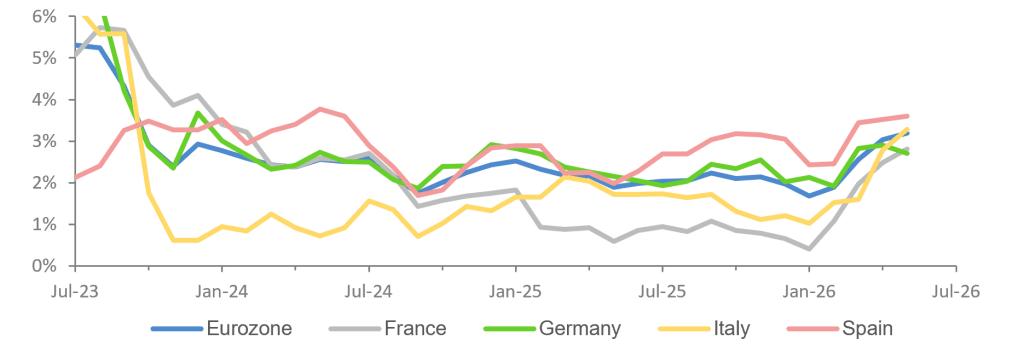
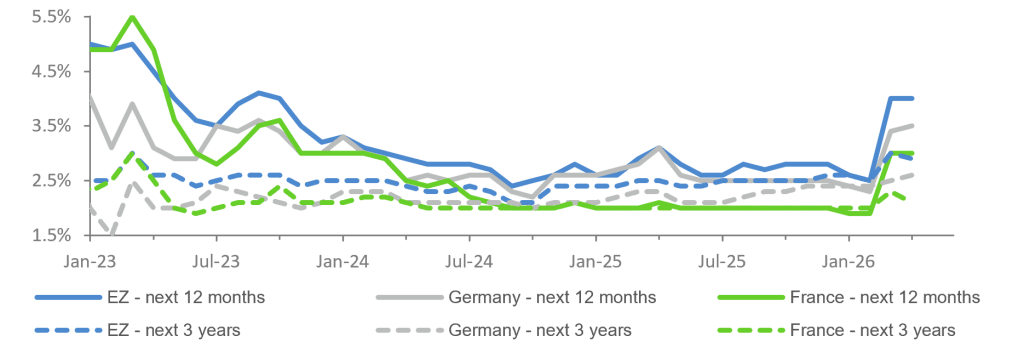
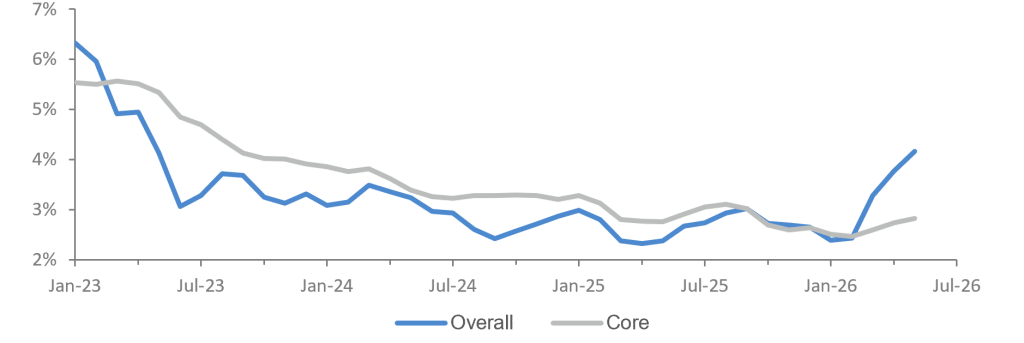
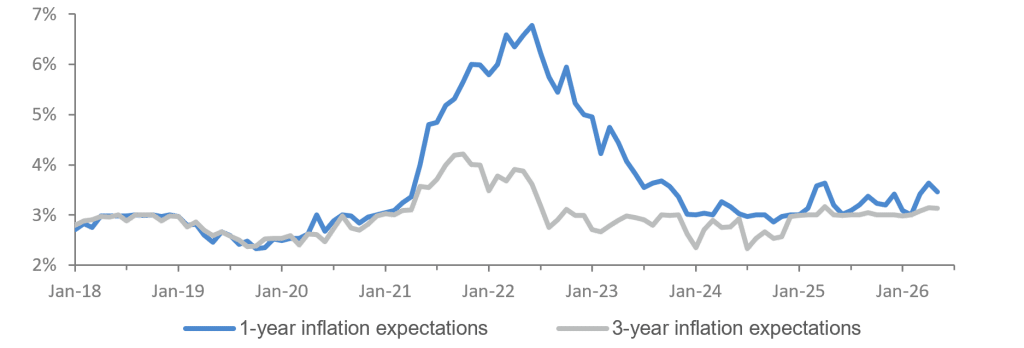
Inflation continued to increase in May, reaching 3.2% (against 3.0% in April), with both market and consumer inflation expectations remaining elevated. This increase reflects several contributing factors:
- A still substantial contribution from services (1.62 percentage points, against 1.38 in April), particularly transport and leisure-related services.
- A high contribution from energy (0.98 percentage points, broadly stable compared with April).
- A rising contribution from industrial goods (0.22 in May, against 0.20 in April).
- A smaller contribution from food, alcohol and tobacco (0.35, down from 0.46).
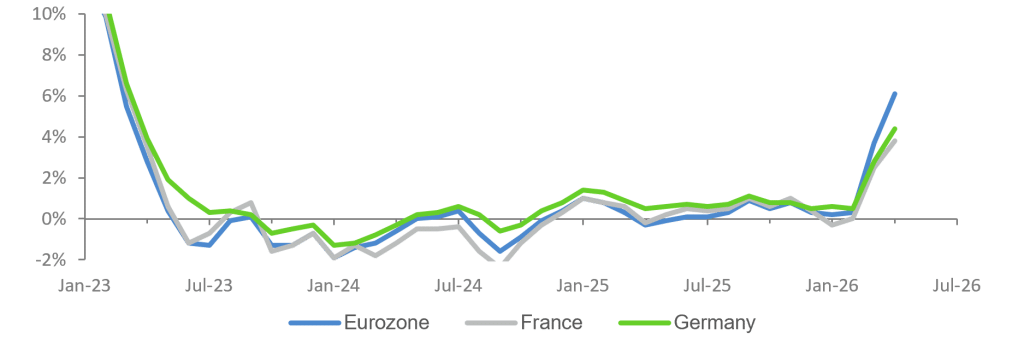
Producer prices in manufacturing also increased significantly, reaching 6.1% year-on-year in April, compared with 3.7% in March and 0.3% in February.
Approximate weights of subcomponents within the consumer price index:
- Services: 45%
- Non-energy industrial goods: 25%
- Food, alcohol, tobacco: 20%
- Energy: 10%
Eurozone: producer prices on the rise in the manufacturing sector
Sources : Accuracy, Eurostat, Macrobond
Eurozone: Consumer Price Index – overall
Sources : Accuracy, Eurostat, Macrobond
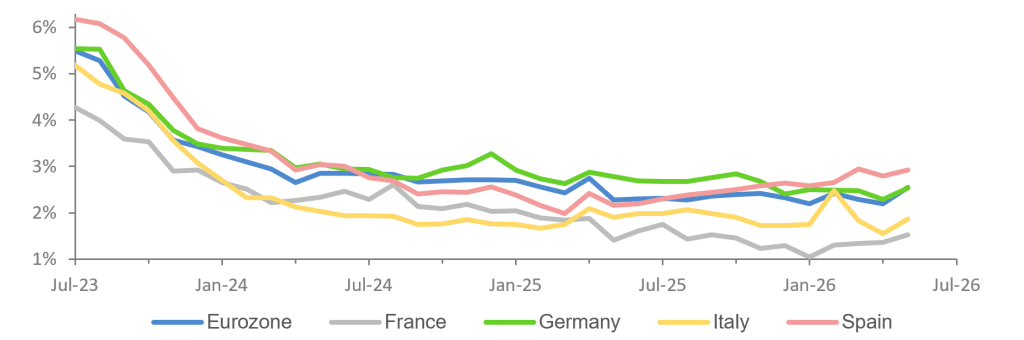
Eurozone: Consumer Price Index – core
Sources : Accuracy, Eurostat, Macrobond
Eurozone: consumer inflation expectations
Sources : Accuracy, ECB, Macrobond
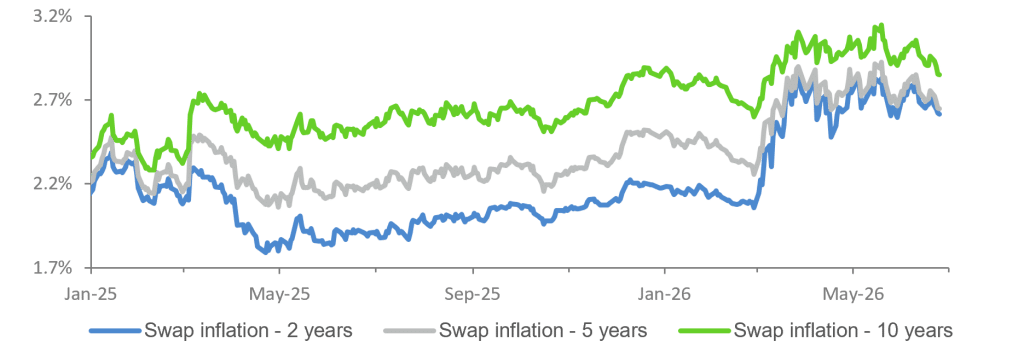
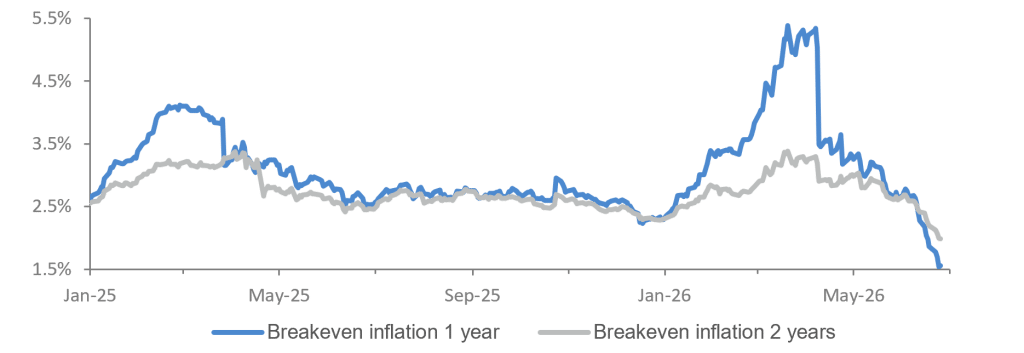
Eurozone: market inflation expectations
Sources : Accuracy, Blomberg
3 – Prices in the United States: an uncomfortable reality, but with expectations proving more resilient than in Europe
United States: Consumer Price Index
Sources : Accuracy, Macrobond
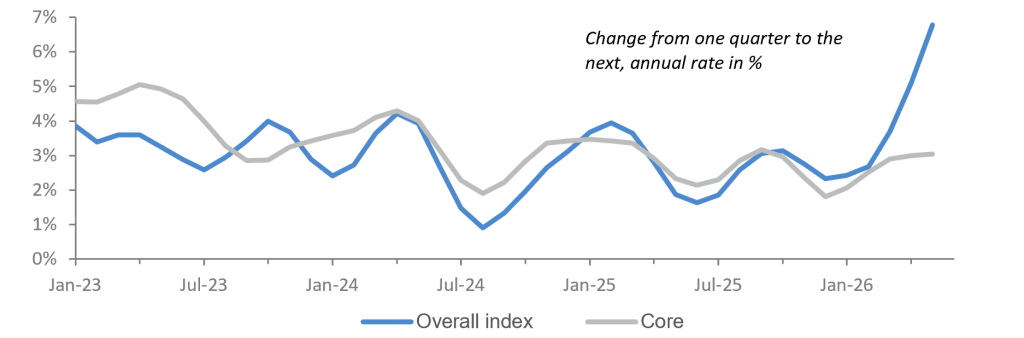
United States: the magnifying-glass effect points to an unwelcome rise in consumer prices
Sources : Accuracy, Macrobond
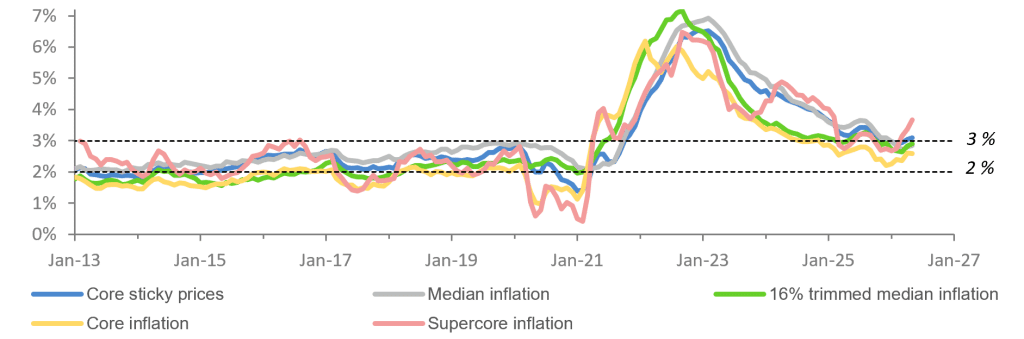
Alternative measures of inflation suggest that price pressures are intensifying
Sources : Accuracy, Macrobond, Bloomberg
United States: consumer inflation expectations
Sources : Accuracy, Macrobond, NY Fed
United States: inflation expectations reflect confidence that the current shocks are temporary
Sources : Accuracy, Bloomberg
Monetary policy: United States and Europe
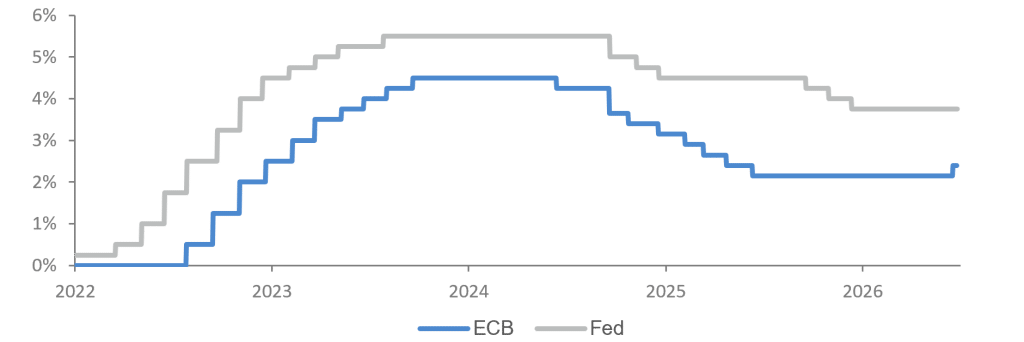
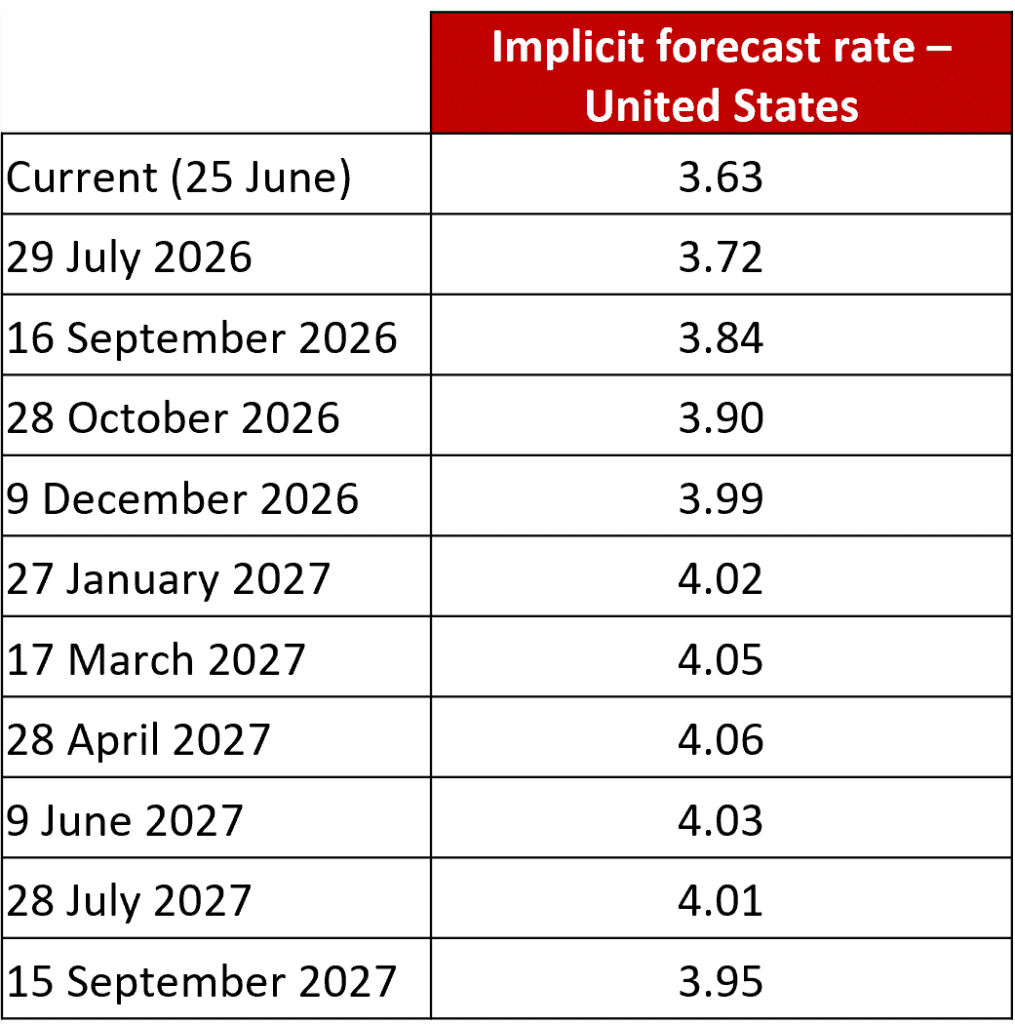
In an environment characterised by uncertainty and a renewed increase in inflation, the ECB and the Federal Reserve met to update their policy rates. While the ECB raised its three main rates by 25 basis points, the Fed chose to remain on hold.
First interest rate rise for the ECB, whilst the Fed maintains its stance
Sources : Accuracy, ECB, Fed, Macrobond
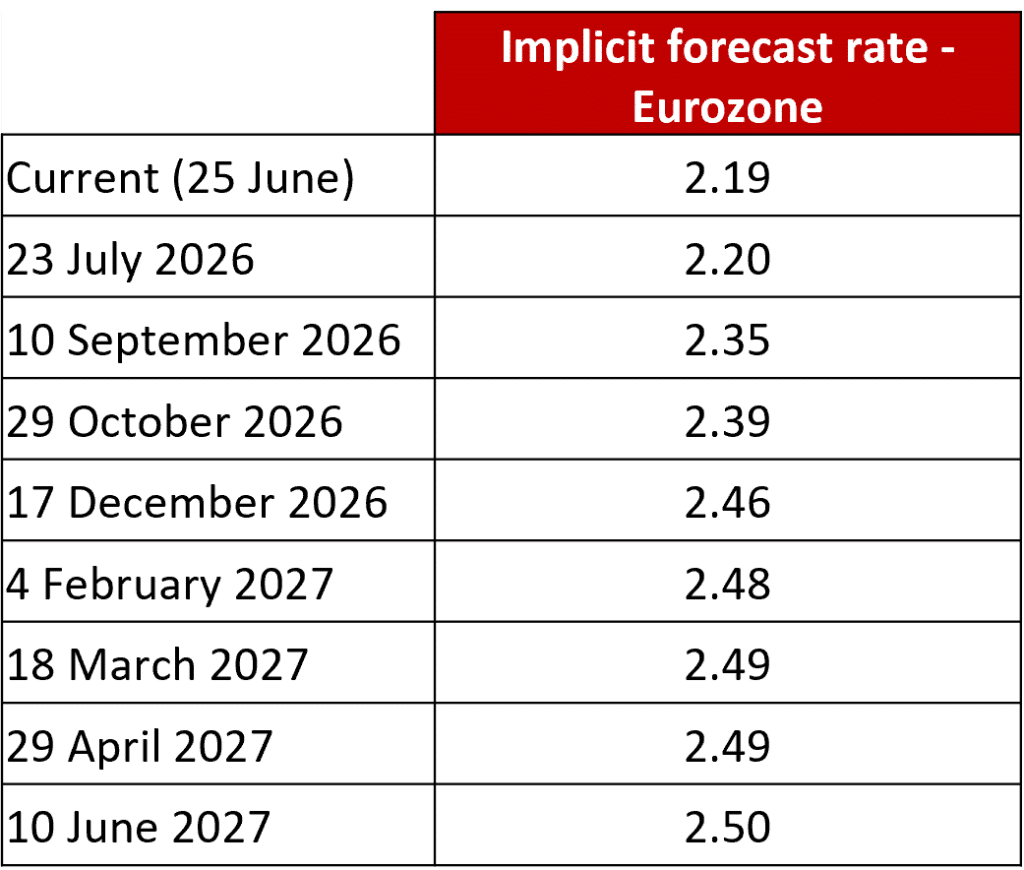
Source : Bloomberg
1 – European Central Bank: assurance
For the first time since September 2023, the ECB opted to increase its key rates by 25 basis points, following three months marked by geopolitical uncertainty.
The aim of this increase is to contain the renewed rise in inflation, with the 2% target still clearly in sight. At the same time, the ECB has revised its inflation forecasts upwards, reflecting expectations of higher-than-anticipated inflation in energy, as well as, to a lesser extent, in food, goods and services.
The ECB nonetheless maintains a cautious tone regarding future developments, providing no explicit guidance on the likely direction of its next decisions. Indeed, the various scenarios considered by the central bank’s staff point to environments that would not call for the same monetary policy response.
Source : ECB
2 – Federal Reserve: the first policy meeting under the new chair
The statement is shorter, with both a clear message and a notable omission: inflatio delenda est (inflation must be brought down) and the previously signalled easing bias has been removed.
Changes to economic projections include:
- Slightly lower growth expected this year (+2.2%, compared with +2.4% projected in March).
- Higher inflation expected (+3.6% for the PCE deflator, against +2.7% previously; +3.3% for core inflation).
- No policy rate cuts expected this year.
- A normalisation phase envisaged in 2027–2028, potentially opening the door to limited rate reductions.
If uncertainty has somewhat diminished regarding growth and unemployment, it has increased with respect to prices, reaching a high level.
Is the current monetary stance restrictive? Possibly when viewed through the lens of the property market, but not at all when one considers financial markets.
Among the changes envisaged by Chair Warsh:
- Forward guidance is deemed less effective in a highly uncertain environment, and the ‘dot plot’ should be revisited.
- The systematic nature of press conferences following each policy meeting could be reconsidered, with communication reserved for moments when a significant message needs to be conveyed.
- Dedicated working groups are being established to initiate changes in areas such as communication, the central bank’s balance sheet, economic data use, productivity, employment and inflation.
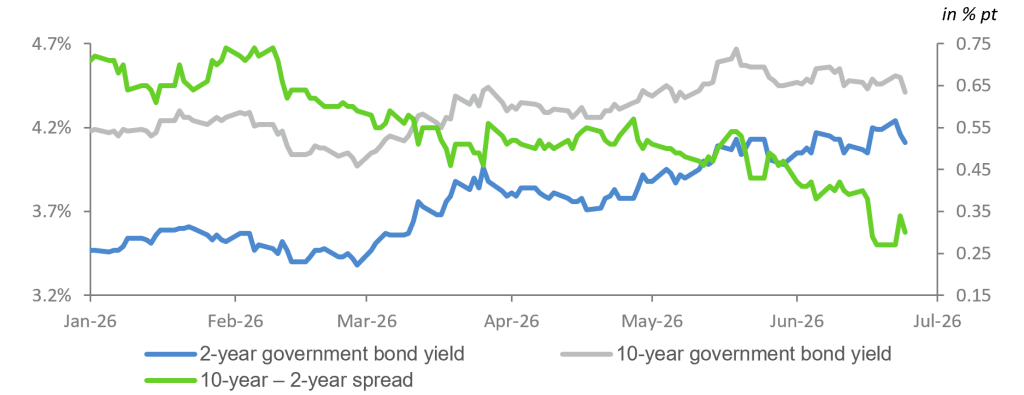
Financial markets interpreted the message as more hawkish than expected: expectations of rate cuts have been pushed back, and the yield curve has flattened.
United-States: yield curve flattens following a tougher-than-expected statement from the Fed
Sources : Accuracy, Macrobond
OECD economic outlook (June 2026): persistent uncertainty
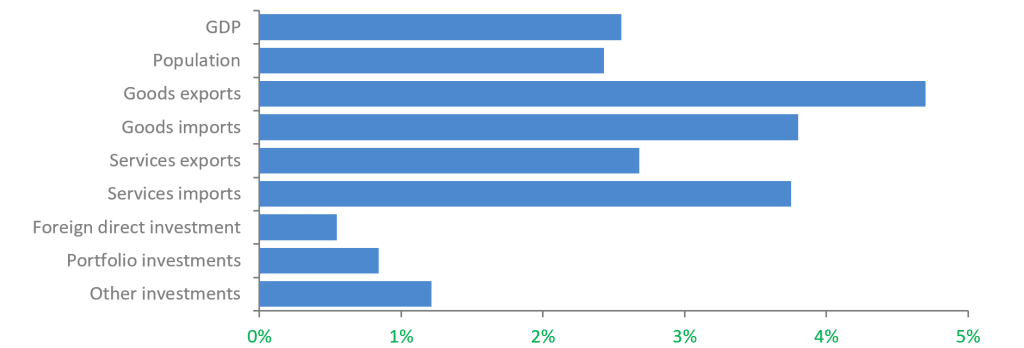
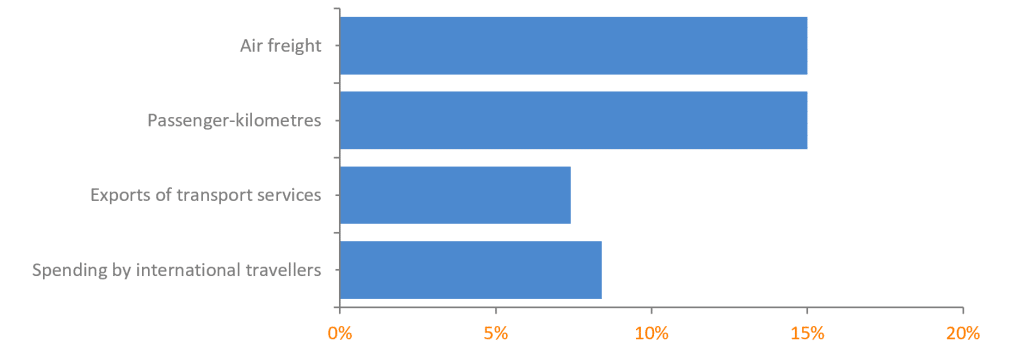
1 – The importance of the Middle East region in global trade
The share of Persian Gulf countries in the global economy (%)
Sources : Accuracy, OECD
The role of the Persian Gulf countries in the global logistics (% of global logistics)
Sources : Accuracy, OECD
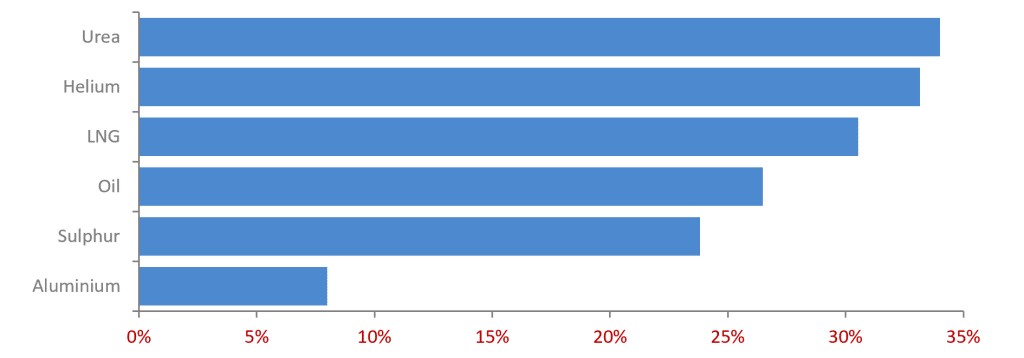
The role of the Persian Gulf countries in commodities (% of global supply)
Sources : Accuracy, OECD
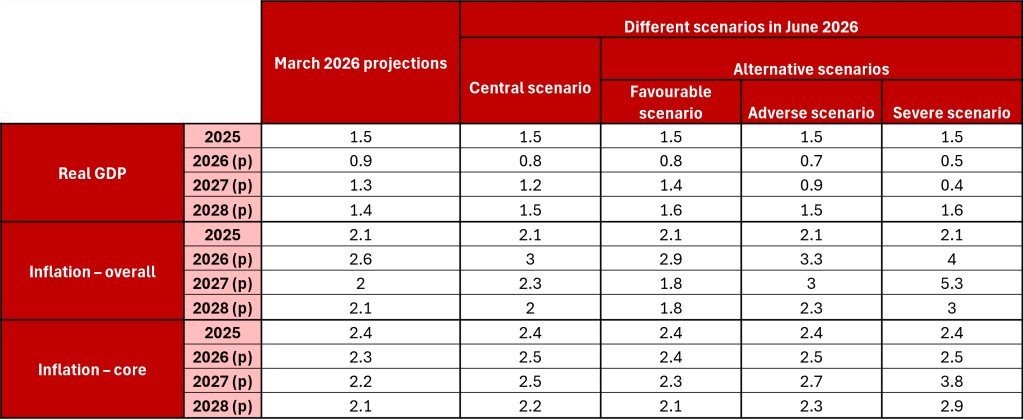
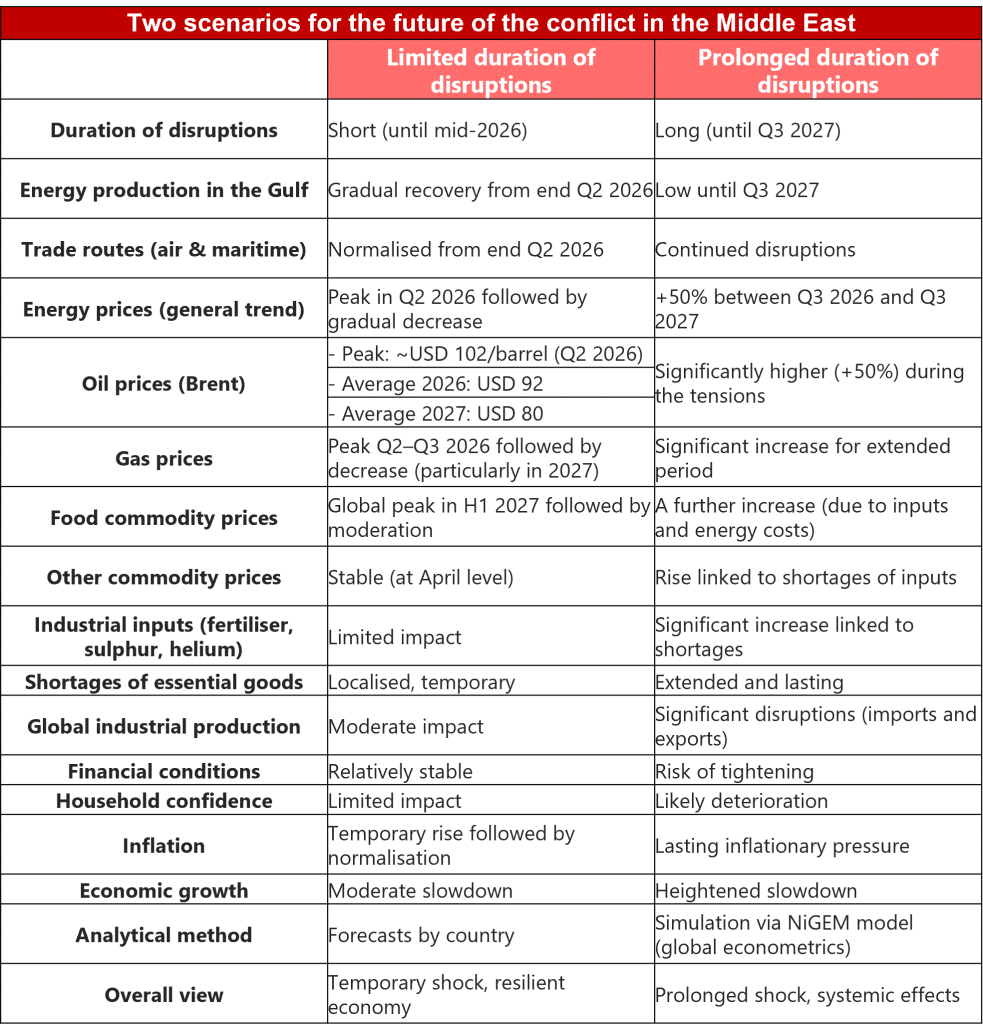
2 – Two central scenarios
Source : OECD
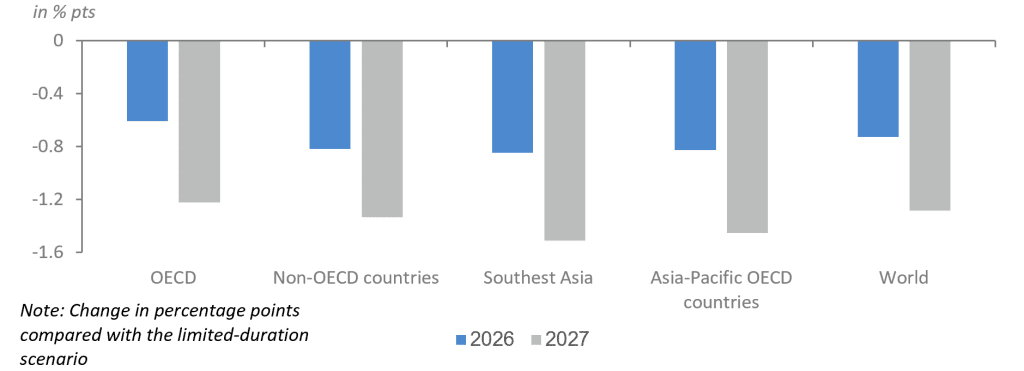
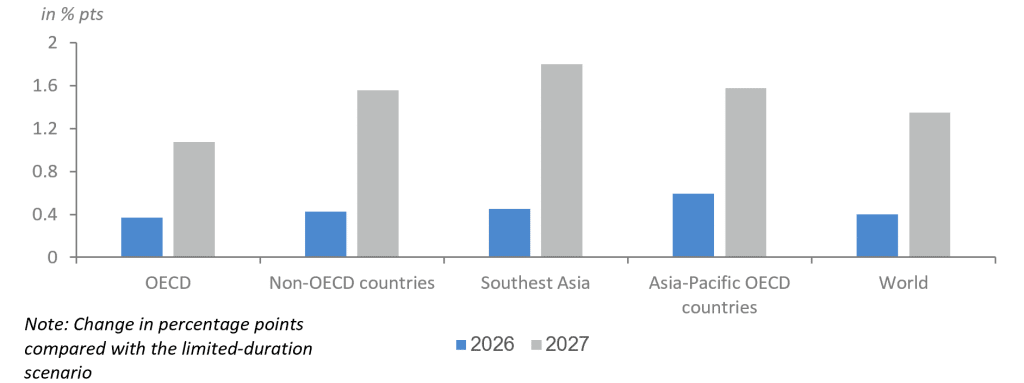
3 – … with potentially sharply divergent outcomes
A proonged disruption scenario that weighs on growth
Sources : Accuracy, OECD
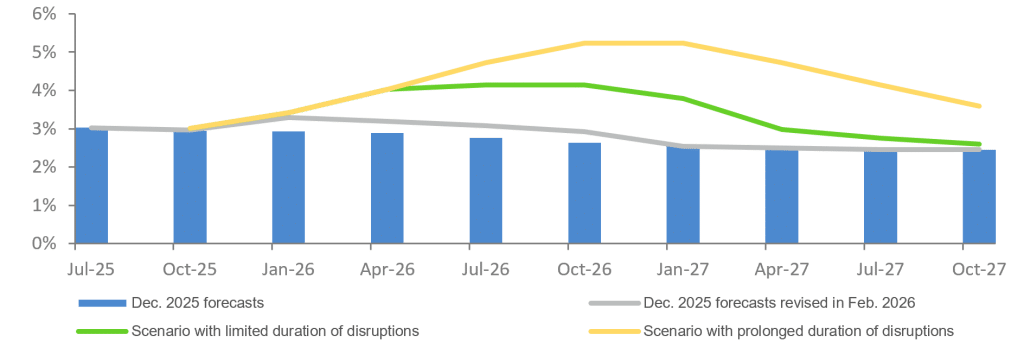
A prolonged disruption scenario that pushes up inflation
Sources : Accuracy, OECD
Global GDP growth
Sources : Accuracy, OECD
Overall inflation of G20
Sources : Accuracy, OECD
China’s external trade and industrial policy
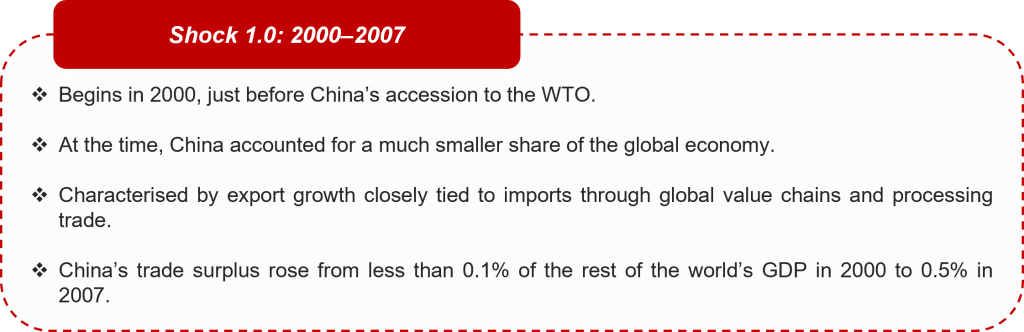
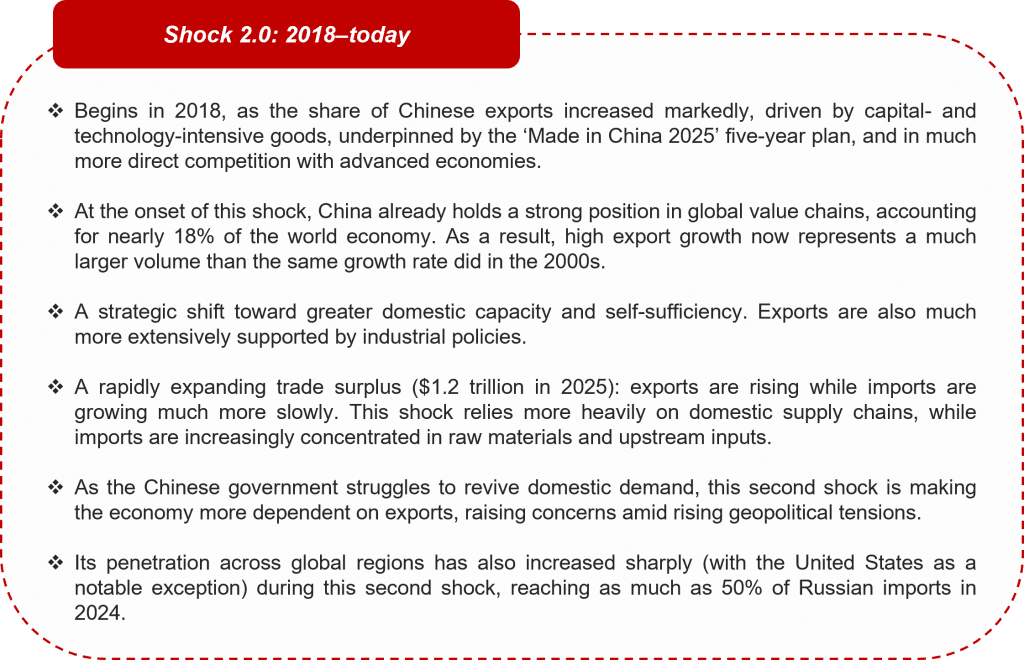
1 – China’s external trade: taking the full measure of the ongoing shock
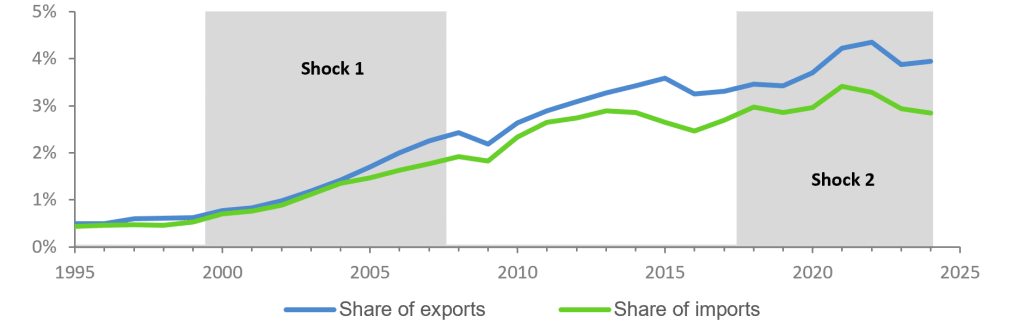
Chinese trade as a percentage of global GDP excluding China (%)
Sources : Accuracy, Fed
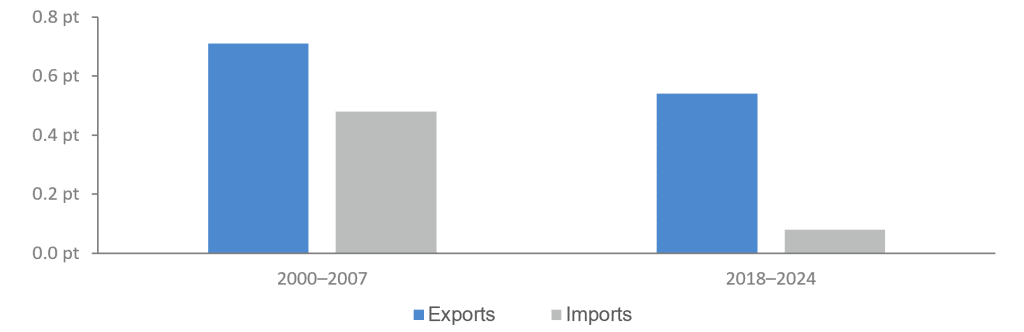
Changes in China’s share of world trade (annualised rate, in % points)
Sources : Accuracy, Fed
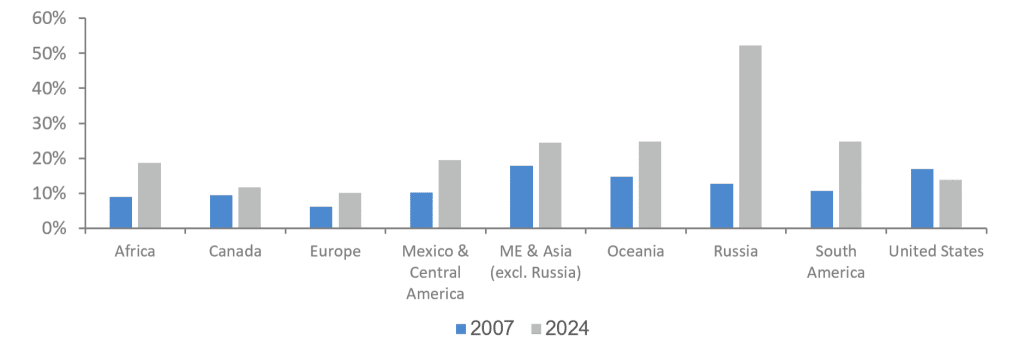
Share of Chinese import by region (%)
Sources : Accuracy, Fed
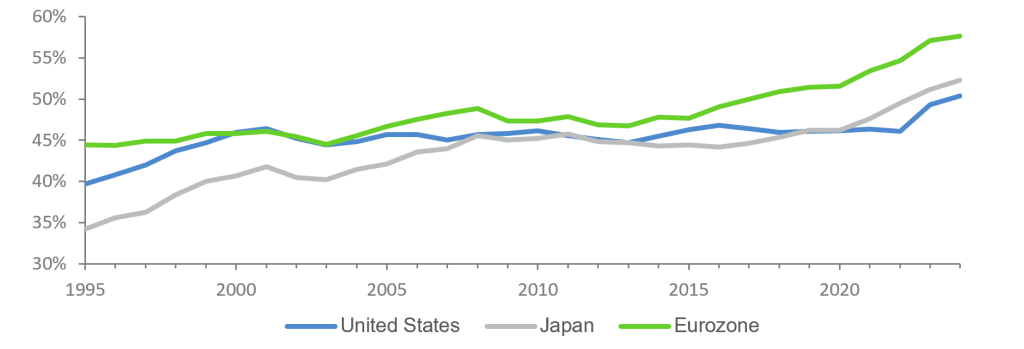
Trends in China’s Export Similarity Index (ESI) compared with certain advanced economies: ever-increasing competitiveness
Sources : Accuracy, Fed
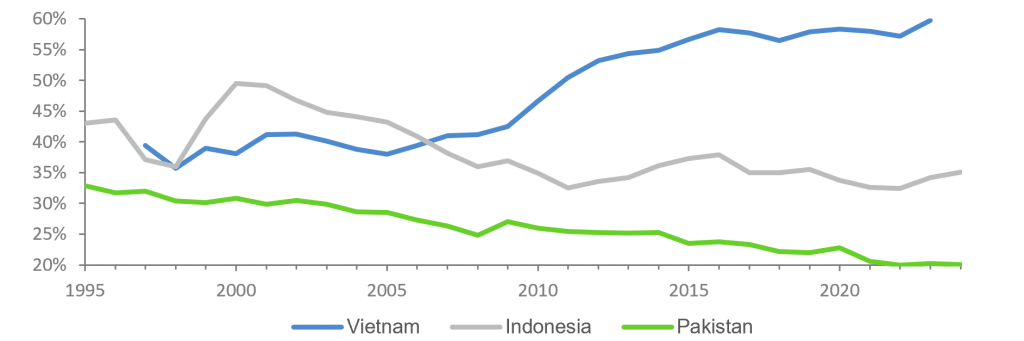
Trends in China’s Export Similarity Index (ESI) with selected emerging economies: divergences in specialisation
Sources : Accuracy, Fed
2 – A new era: how industrial policies are adapting as best they can
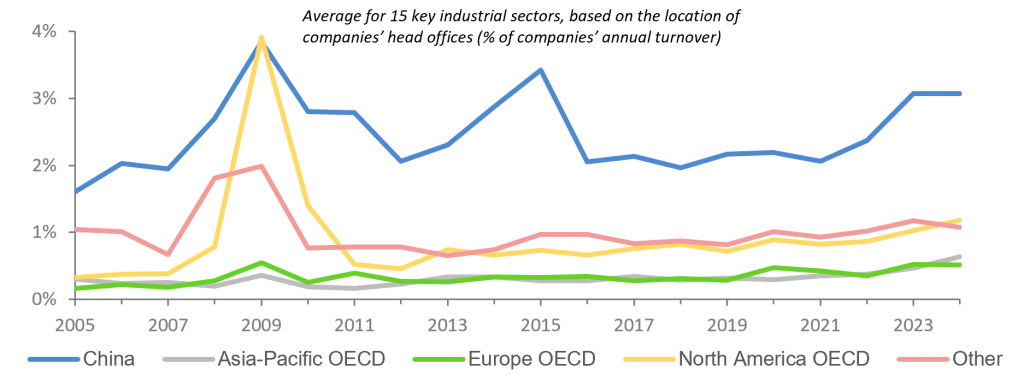
These dual shocks emanating from China have affected a large number of countries worldwide, including the European Union, with which China is competing in an increasing number of sectors (such as automotive and pharmaceuticals). How should policymakers respond?
Recent years provide an initial answer. As global shocks have multiplied, countries have turned to industrial policies in an effort to maintain the safeguards protecting their domestic industries. The current war in Iran illustrates this clearly: in the space of two months (March–April 2026), the IMF has counted some 205 new industrial policies.
This trend has been particularly pronounced since the Covid-19 crisis, which rekindled interest in measures with a protectionist dimension. These policies, often geared towards supply chain resilience, national security and geopolitical considerations, aim to reduce dependence on geopolitical rivals and to protect sectors deemed strategic.
However, while their short-term effects can appear convincing, the positive impact of industrial policies tends to be short-lived. Subsidies may initially boost investment, but their effects on productivity and output weaken over time and may even reverse. Moreover, such policies typically reallocate resources towards targeted entities, potentially to the detriment of more productive firms and the economy as a whole. They may also trigger imitation elsewhere, leading to a costly and inefficient global policy race.
In this context, structural reforms appear better suited to achieving governments’ objectives. Improvements in institutional and regulatory frameworks could increase output in inefficient industries by up to 10% over the medium term (IMF) – around five times more than industrial policy alone. Such reforms benefit all sectors, avoid the pitfalls of picking winners, and can even enhance the effectiveness of industrial policy where it is deployed.
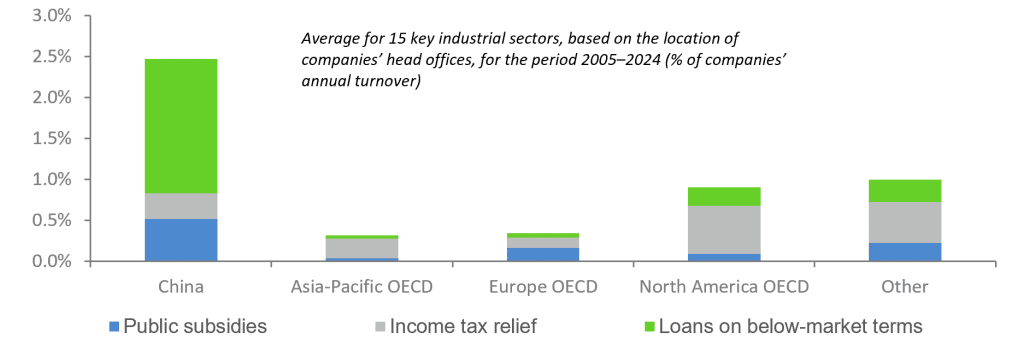
The level of industrial subsidies varies considerably from region to region
Sources : Accuracy, OECD
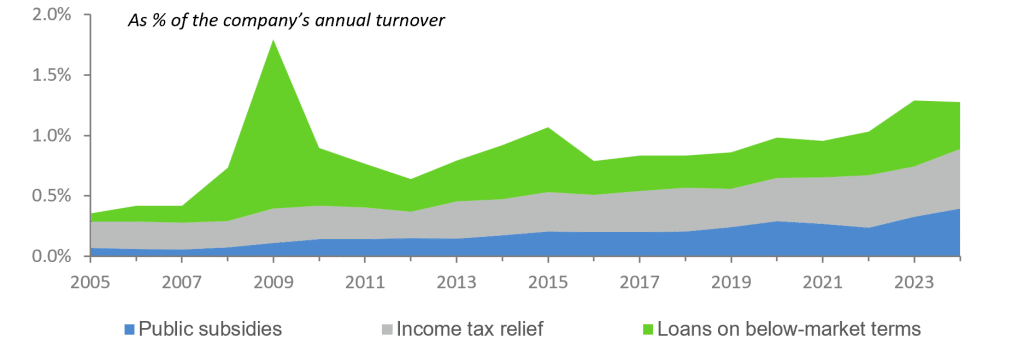
Global industrial subsidies across 15 key industrial sectors
Sources : Accuracy, OECD
Trends in industrial subsidies between 2005 and 2024, shoowing continuous growth
Sources : Accuracy, OECD
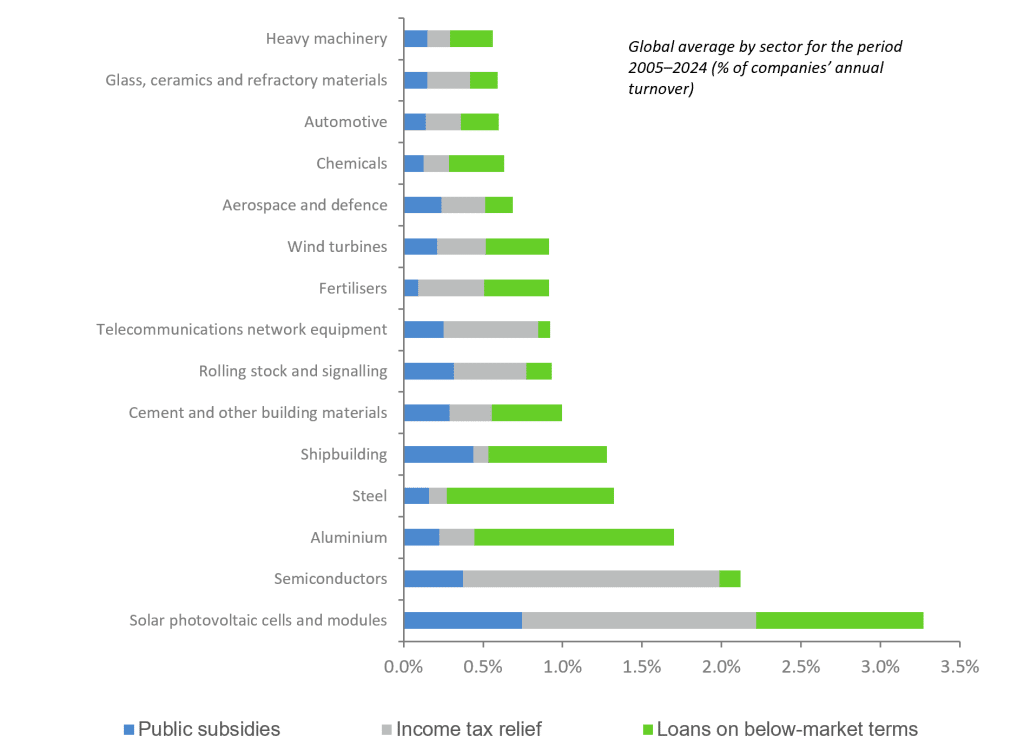
Global industrial subsidies vary by sector
Sources : Accuracy, OECD
Demographics: the paradox of an ageing population and an improving dependency ratio
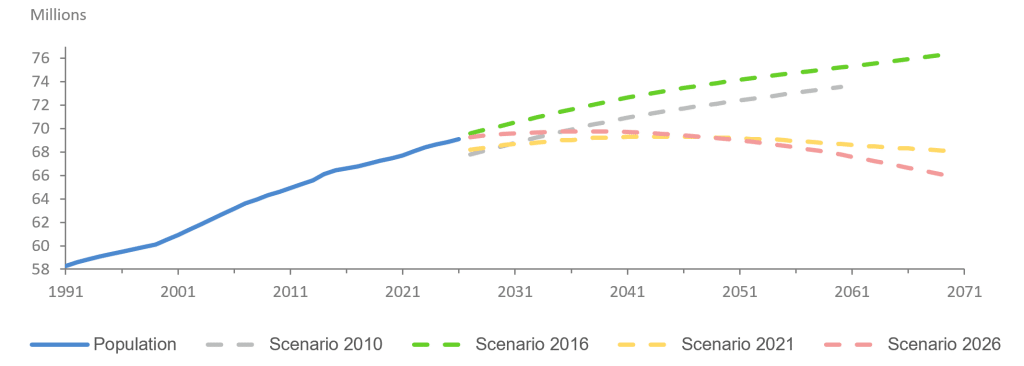
France, like many other countries, is approaching a decisive turning point, with the beginning of a decline in its population. After peaking at 69.8 million in 2037 – supported by a positive migration balance – the population is projected by INSEE, the national statistics institute, to fall to 65.9 million by 2070, representing 3.2 million fewer than in 2026. This marks a clear break from earlier INSEE projections (notably those of 2010 and earlier 2026 scenarios), which did not anticipate a population decline at all.
Trends in the French population according to INSEE
Sources : Accuracy, INSEE
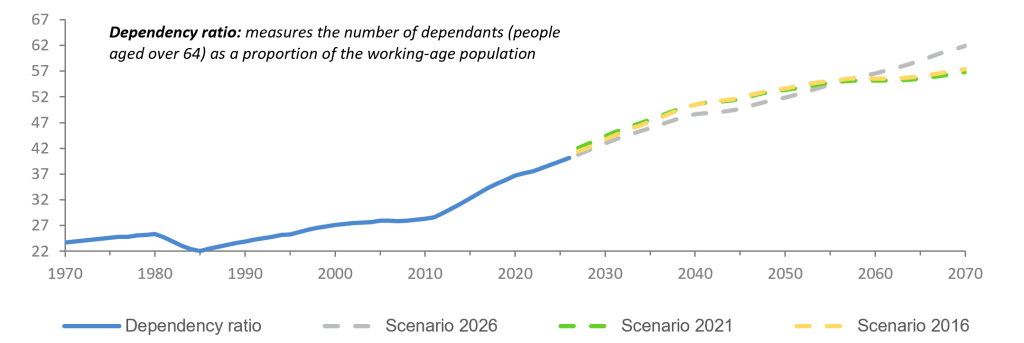
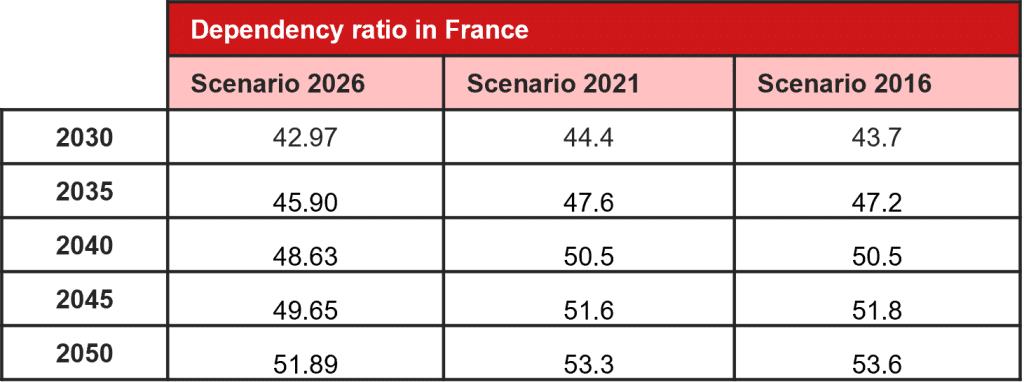
Paradoxically, the dependency ratio, which measures the weight of dependent populations relative to those of working age, appears to improve in the 2026 scenario compared with earlier projections (2016 and 2021).
This can be explained by higher projected migration flows in the short term, which mechanically increase the share of the working-age population and therefore reduce the dependency ratio. In addition, life expectancy is expected to rise more moderately, slightly slowing the ageing process compared with earlier assumptions.
However, with the dependency ratio still set to increase significantly over time, the challenges associated with an ageing population remain central:
- Pension systems, with a growing number of retirees living longer
- Labour markets, with fewer workers and contributors
- Public finances, with increasing expenditure linked to ageing (social support and infrastructure needs)
Dependency ratio: an ageing population
Sources : Accuracy, INSEE
Source : INSEE
FOCUS: the economics and geography of intangibles
Rising tensions are weighing on international trade and could diminish its role as an engine of growth. Yet the changes underway cannot be explained by geopolitics alone: they also reflect the growing importance of services, intangible assets and information industries. In advanced economies, the economic weight of manufacturing is declining, while market services, R&D, software, branding and digital activities are expanding. This shift is mirrored in global trade: services are growing faster than goods, buoyed by digitalisation and artificial intelligence. The geography of trade itself is changing: physical distance matters less, while institutional, legal, political and cultural proximity becomes decisive.
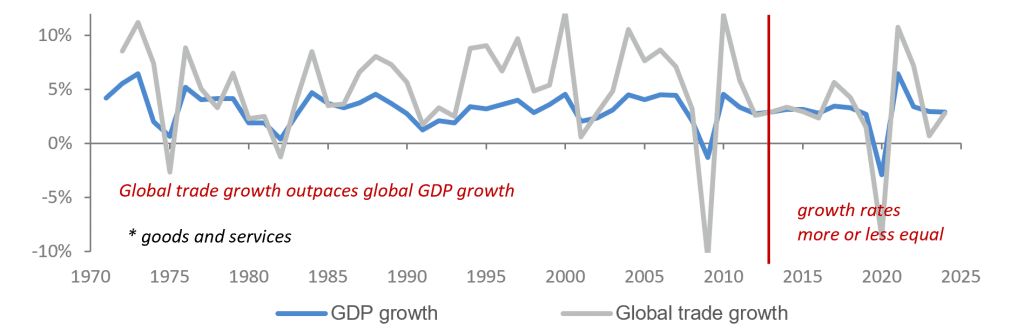
The world is changing, and tensions are on the rise. By the end of the first quarter of this year, 42 countries were involved in active conflict – defined as significant armed hostilities involving casualties – whether inter-state, intra-state, non-state or extra-systemic (a state fighting a non-state armed group outside that state’s territory). Since 1989, the number had not exceeded 40 (with the average slightly below 30). Now, nearly half of the world’s population is affected by this violent reality, which unsurprisingly fuels a growing sense of exposure to risk. As a result, trade flows, including economic exchanges, are hampered, and international trade can no longer be taken for granted as an accelerator of global growth – it may even become a drag. This represents a major shift in the business environment. Hyper-globalisation – understood as a period during which global trade expands more rapidly than global output – began to fade from the 2010s onwards, with both variables growing at broadly similar rates. Are we now entering an era of hypo-globalisation?
Current developments would appear to suggest so, particularly in the context of the war around the Persian Gulf. On one side stand the United States on the front line; on the other, albeit more indirectly, China and Russia. Europe, meanwhile, hesitates over its positioning on the world stage: closely aligned with Washington, yet with a certain unease, or tempted by a more non-aligned stance perhaps? A more inward-looking economic model, implying fewer international linkages and likely lower barriers between the productive sector and the state, would shift the growth engine from external trade towards domestic demand.
Growth in world trade* compared with GPD growth
Sources : Accuracy, World Bank, Macrobond
But the lens must be widened. The changes underway or to come in international economic relations are not solely a matter of geopolitical tensions or political repositioning. Structural transformations in both the supply of and demand for goods and services must also be taken into account.
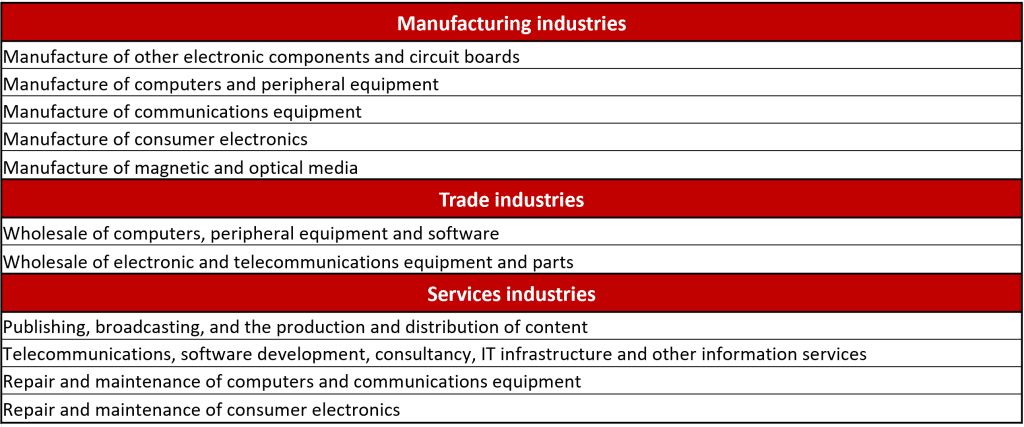
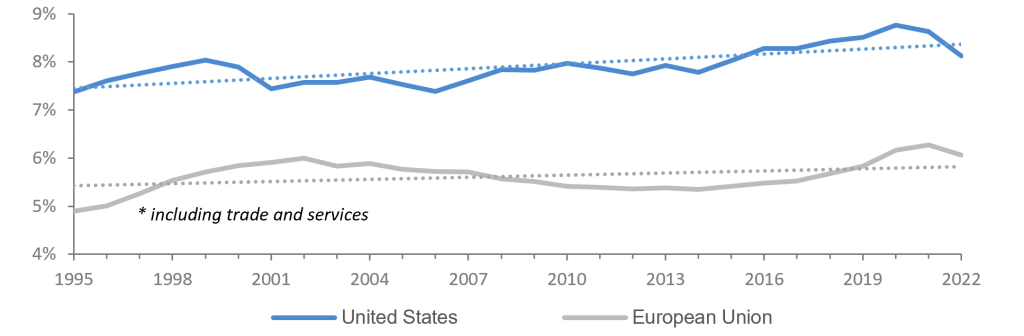
In most advanced economies, the weight of the manufacturing sector has steadily declined in favour of services. In the United States, manufacturing value-added has fallen from 17% of the total in 1995 to around 11% in the first half of the current decade, while market services have risen from 50% to approximately 56%. Within this shift, ‘information industries’ stand out. Their scope is broad, spanning manufacturing (computers and electronic equipment) and services (IT services media), as well as distribution activities. The trend is clearly one of expansion: within the European Union, their share has jumped from less than 5% to nearly 7%; in the United States, from just over 7% to almost 9%.
Sectors grouped under information industries
Source : OECD
Share of value added by the information industries* in total value added
Sources : Accuracy, OECD (TiVA basis)
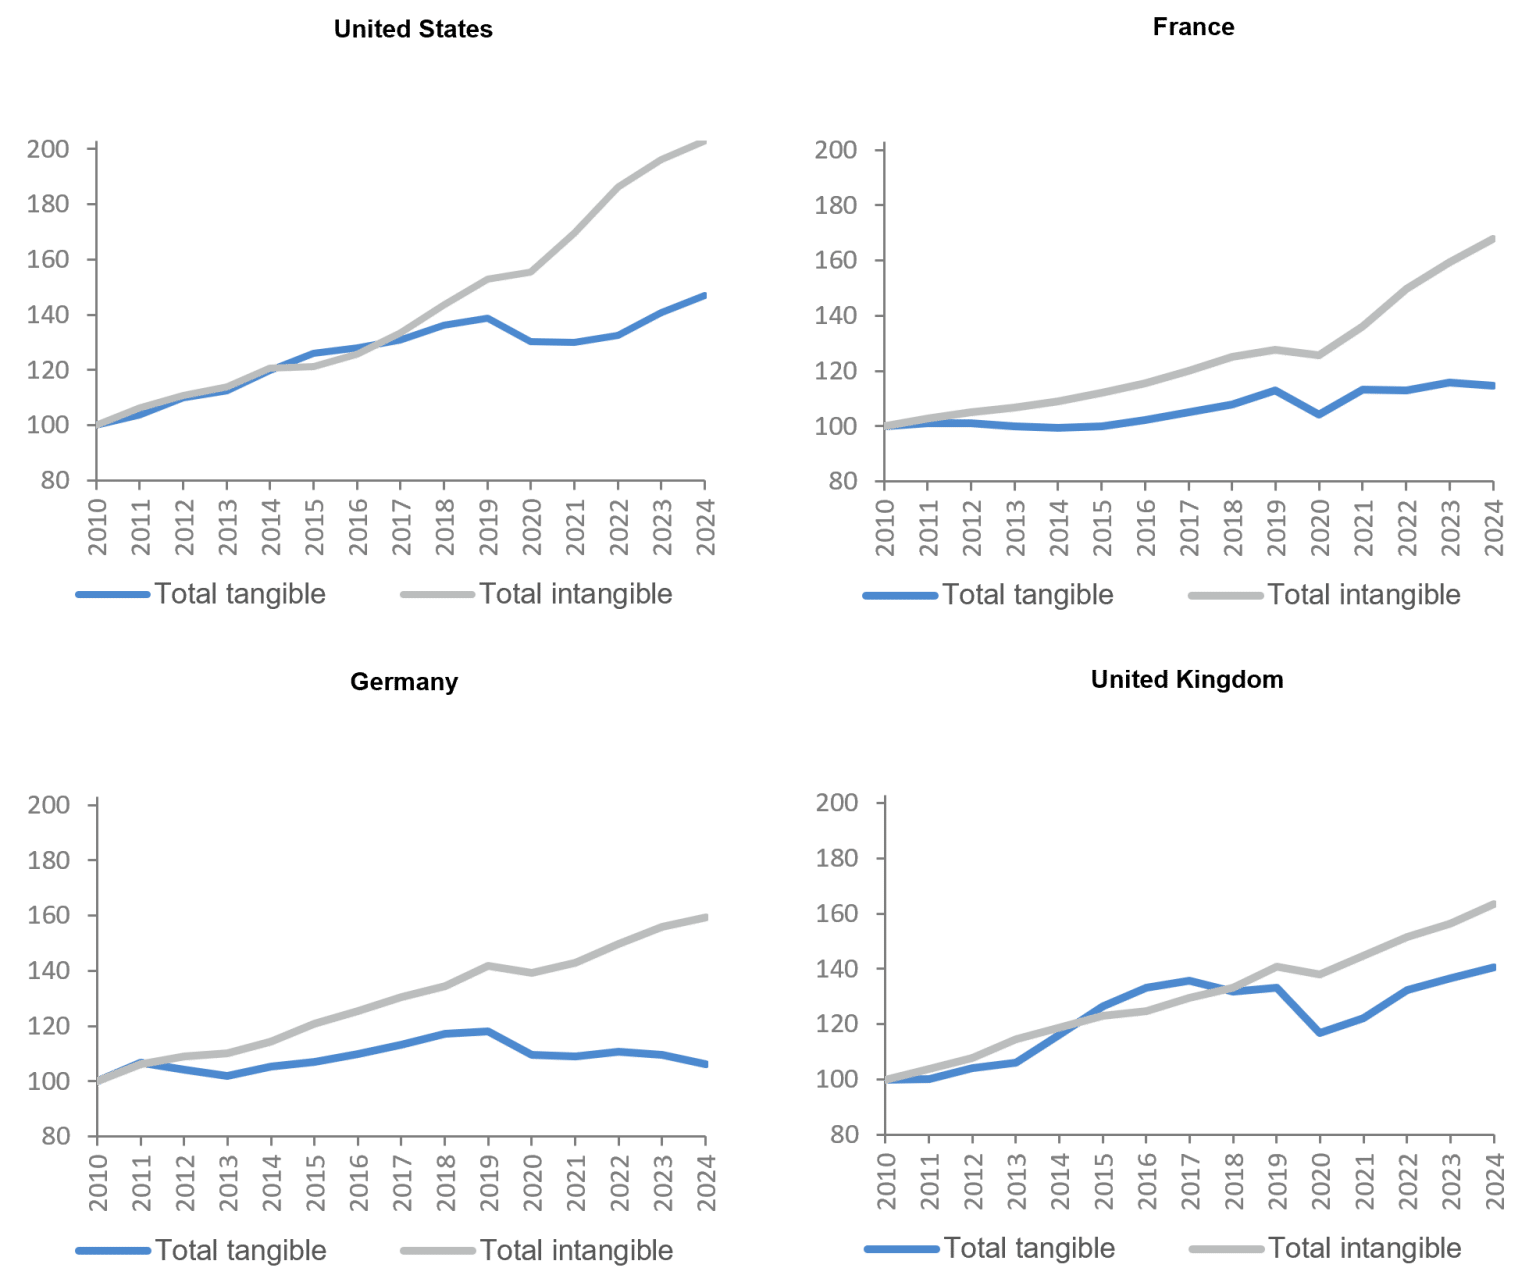
Turning to demand, let us focus on investment, with a first distinction able to be drawn between tangible and intangible investment. In the case of US firms, based on constant-price data for 2025, the former (buildings and equipment) accounts for 56% of the total, while the latter (software, R&D, brands, etc.) represents 44%. It is worth noting that intangible investment growth is stronger worldwide.
Investment: the strongest growth in intangible assets
Sources : Accuracy, WIPOO, LUISS
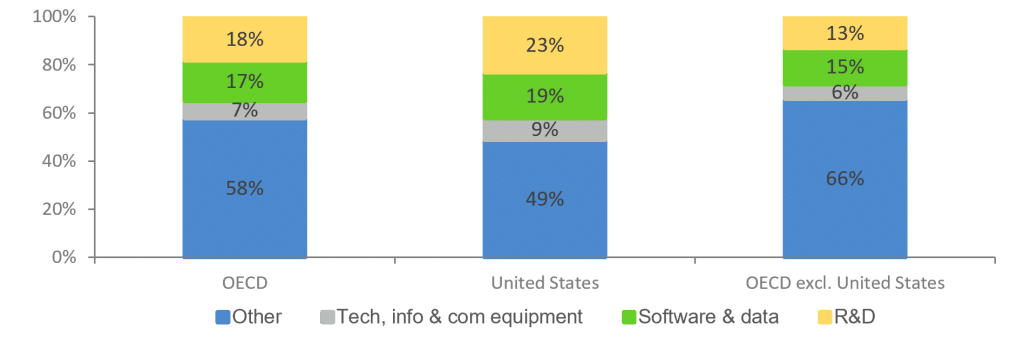
A second distinction separates information industries from R&D and the remainder. The information industries now represent around 30% of total US investment, compared with just over 20% in other OECD countries. Over the period from 2007 to 2023, the growth dynamic has been very much in their favour: an increase by a factor of around 3.5 in the United States, compared with 2 for R&D and 1.3 for the remainder (elsewhere in the OECD, the growth rate factors could be estimated at respectively 2.5, 1.4 and 1.3).
Share of nominal gross investment by asset type, as a percentge of business investment (2023 or latest available year)
Sources : Accuracy, OECD
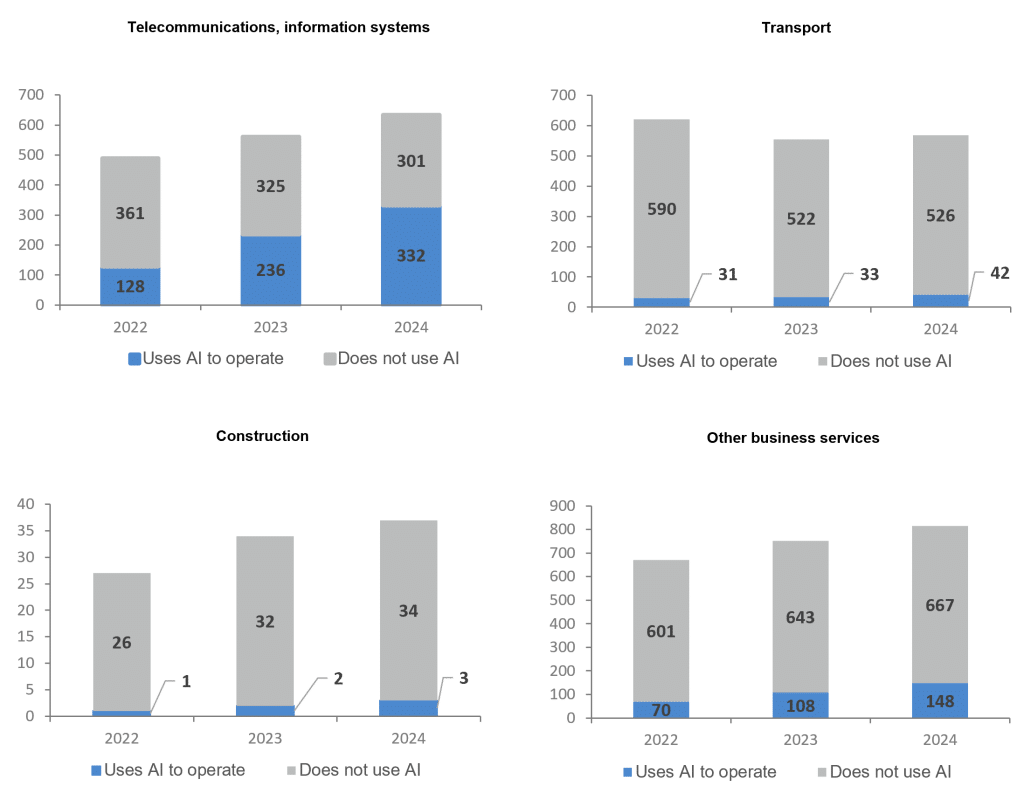
If intangible assets and the information industries are taking up an increasing share of investment effort, and therefore contributing progressively more to economic growth, then their share in external trade can also, in all likelihood, only increase. Let us first return to the distinction between services and manufactured goods. According to the IMF, between 2011 and 2023, global trade in services (in current dollars) grew by an average of 4.7% per year, compared with 2.2% for goods. Using a different approach (measuring volumes rather than values), and focusing on the most recent period (2023–2025), the WTO reaches a very similar conclusion. Global trade in services is growing at a faster rate: 7.5%, 7.8% and 5.3% each year respectively versus -0.9%, 2.7% and 4.6% for manufactured goods. The OECD offers a synthetic view for the G20 economies (which represent some 85% of global GDP). At the beginning of 2012, trade in services among these countries was roughly four times smaller than trade in goods; by mid-2025, the ratio had narrowed to one to three. Let us now consider services embedded within information industries. Two points may be made. First, the IMF notes that the observed pace partly reflects ‘strong growth in digitalisation, which facilitates cross-border trade in services’. Deuxièmement, the WTO highlights the role played by the recent diffusion of artificial intelligence (the analysed period covers 2022 to 2024) in boosting exports in certain service sectors, notably telecommunications, IT and business services.
European Union: estimates of AI-enabled service exports, by sector, 2022-2024 (in billions of $)
Sources : Accuracy, WTO
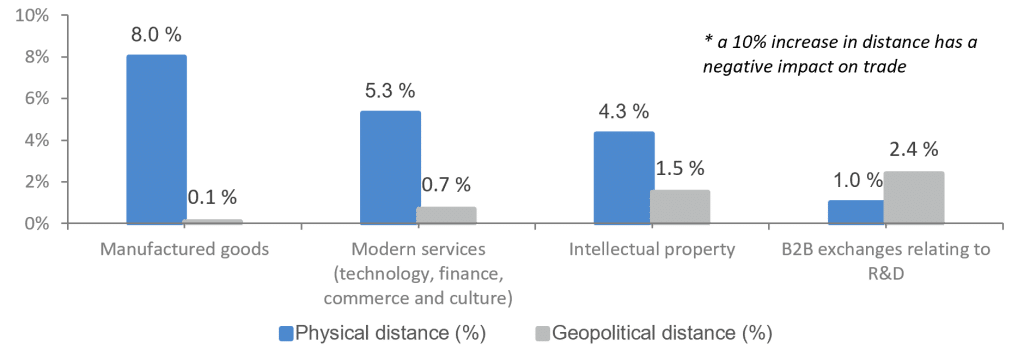
The transformation of the economy is continuing: from an organisation centred on goods towards one increasingly centred on intangibles. Indeed, it is accelerating. This has implications for the architecture of international trade relations for one key reason: intangible flows are far less constrained by geography. In the case of goods, ‘gravity models’ explain trade flows by the size of economies and by the physical distance between them. By contrast, exchanges within the intangible economy are much less subject to this ‘law’. Ideas, technologies and associated services are largely transmitted electronically, and the reduced role of physical goods in value chains is no obstacle to exchange. Supply, combining creation, protection and commercialisation capabilities, can meet demand across very great distances. Distance, where it does inhibit exchange, is of a different nature: it reflects differences in legal frameworks, regulatory standards and levels of trust. Compatibility between institutional, political and even cultural environments thus becomes crucial. This proximity is measured less in physical terms than in geopolitical terms, often using indicators such as the alignment of voting behaviour at the United Nations.
From one sector to another: the cost* of physical distance is falling, whilst that of geopolitical distance is rising
Sources : Accuracy, ECIPE
The product mix of the economy is evolving, with an increasing share allocated to modern services, technology and R&D. The geography of trade is – and will continue to be – transformed. It is not only the degree of globalisation that is changing, but also its very content. Such an organisation cannot be entirely insulated from a high level of international tension. Yet one may nonetheless ask whether geopolitical distance is less affected than physical distance – provided, of course, that the logic of alliances remains intact.
Hervé Goulletquer, conseiller économique principal, Accuracy